Long-term changes in phytoplankton

Productivity

Because phytoplankton are so crucial to ocean biology and climate, any change in their productivity could have a significant influence on biodiversity, fisheries and the human food supply, and the pace of global warming.

Many models of ocean chemistry and biology predict that as the ocean surface warms in response to increasing atmospheric greenhouse gases, phytoplankton productivity will decline. Productivity is expected to drop because as the surface waters warm, the water column becomes increasingly stratified; there is less vertical mixing to recycle nutrients from deep waters back to the surface.

Graph showing the inverse relationship between temperature and chlorophyll concentration in the stratified oceans.

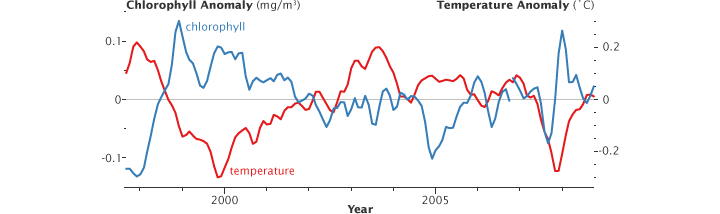
About 70% of the ocean is permanently stratified into layers that don’t mix well. Between late 1997 and mid-2008, satellites observed that warmer-than-average temperatures (red line) led to below-average chlorophyll concentrations (blue line) in these areas. (Graph adapted from Behrenfeld et al. 2009 by Robert Simmon.)

Over the past decade, scientists have begun looking for this trend in satellite observations, and early studies suggest there has been a small decrease in global phytoplankton productivity. For example, ocean scientists documented an increase in the area of subtropical ocean gyres—the least productive ocean areas—over the past decade. These low-nutrient “marine deserts” appear to be expanding due to rising ocean surface temperatures.

Species composition

Hundreds of thousands of species of phytoplankton live in Earth's oceans, each adapted to particular water conditions. Changes in water clarity, nutrient content, and salinity change the species that live in a given place.

Because larger plankton require more nutrients, they have a greater need for the vertical mixing of the water column that restocks depleted nutrients. As the ocean has warmed since the 1950s, it has become increasingly stratified, which cuts off nutrient recycling.

Continued warming due to the build up of carbon dioxide is predicted to reduce the amounts of larger phytoplankton such as diatoms), compared to smaller types, like cyanobacteria. Shifts in the relative abundance of larger versus smaller species of phytoplankton have been observed already in places around the world, but whether it will change overall productivity remains uncertain.

Graph showing the reduction in proportion of diatoms in the ocean as atmospheric carbon dioxide increases.

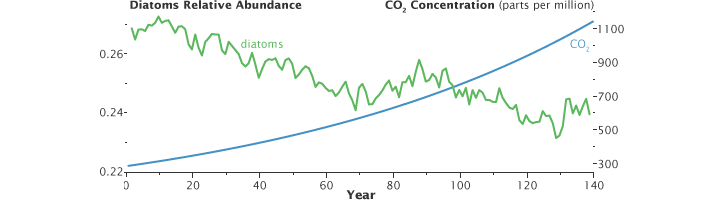
As carbon dioxide concentrations (blue line) increase in the next century, oceans will become more stratified. As upwelling declines, populations of larger phytoplankton such as diatoms are predicted to decline (green line). (Graph adapted from Bopp 2005 by Robert Simmon.)

These shifts in species composition may be benign, or they may result in a cascade of negative consequences throughout the marine food web. Accurate global mapping of phytoplankton taxonomic groups is one of the primary goals of proposed future NASA missions like the Aerosol, Cloud, Ecology (ACE) mission.

  1. References

  2. Behrenfeld, M. J., Siegel, D. A., O’Malley, R. T., and Maritorena, S. (2009). Global ocean phytoplankton. In T.C. Peterson, and M. O. Baringer (Eds.), State of the Climate in 2008. Bulletin of the American Meteorological Society. 90(8), S68–S73.
  3. Behrenfeld, M. J., O’ Malley, R. T., Siegel, D. A., McClain, C. R., Sarmiento, J. L., Feldman, G. C., Milligan, A. J., et al. (2006). Climate-driven trends in contemporary ocean productivity. Nature, 444(7120), 752-755.
  4. Behrenfeld, M. J. (2010). Abandoning Sverdrup’s Critical Depth Hypothesis on phytoplankton blooms. Ecology, 91(4), 977-989.
  5. Bopp, L. (2005). Response of diatoms distribution to global warming and potential implications: A global model study. Geophysical Research Letters, 32(L19606).
  6. Carbon Cycle. (2009). UNEP/GRID-Arendal Maps and Graphics Library. Retrieved June 1, 2010.
  7. Diaz, R. J., & Rosenberg, R. (2008). Spreading Dead Zones and Consequences for Marine Ecosystems. Science, 321(5891), 926-929.
  8. Feldman, G., Clark, D., & Halpern, D. (1984). Satellite color observations of the phytoplankton distribution in the Eastern equatorial pacific during the 1982-1983 El Niño. Science, 226(4678), 1069–1071.
  9. Gaines, S., & Airame, S. (n.d.). Background: Upwelling. NOAA Ocean Explorer Website: Sanctuary Quest. Retrieved May 20, 2010.
  10. Goes, J. I. Goes, J. I., Thoppil, P. G., Gomes, H. D. R., & Fasullo, J. T. (2005). Warming of the Eurasian Landmass Is Making the Arabian Sea More Productive. Science, 308(5721), 545-547.
  11. Hallegraeff, G. M. (2010). Ocean Climate Change, Phytoplankton Community Responses, And Harmful Algal Blooms: A Formidable Predictive Challenge. Journal of Phycology, 46(2), 220-235.
  12. Hendiarti, N., Siegel, H., & Ohde, T. (2004). Investigation of different coastal processes in Indonesian waters using SeaWiFS data. Deep Sea Research Part II: Topical Studies in Oceanography, 51(1-3), 85-97.
  13. Gregg, W. (2003). Ocean primary production and climate: Global decadal changes. Geophysical Research Letters, 30(15).
  14. McClain, C. R., Signorini, S. R., & Christian, J. R. (2004). Subtropical gyre variability observed by ocean-color satellites. Deep Sea Research Part II: Topical Studies in Oceanography, 51(1-3), 281-301.
  15. Polovina, J. J., Howell, E. A., & Abecassis, M. (2008). Ocean’s least productive waters are expanding. Geophysical Research Letters, 35(3).
  16. Richardson, A. J., & Schoeman, D. S. (2004). Climate Impact on Plankton Ecosystems in the Northeast Atlantic. Science, 305(5690), 1609-1612. Susanto, R. D., Moore, T. S., & Marra, J. (2006). Ocean color variability in the Indonesian Seas during the SeaWiFS era. Geochemistry Geophysics Geosystems, 7, Q05021.
  17. Yoder, J. A., & Kennelly, M. A. (2003). Seasonal and ENSO variability in global ocean phytoplankton chlorophyll derived from 4 years of SeaWiFS measurements. Global Biogeochemical Cycles, 17(4), 1112.