| Ozone in the Troposphere | |||
Ozone forms naturally through the atmosphere’s interaction with sunlight. A complex series of reactions takes place over several hours (and sometimes over several days) involving nitrogen oxides (NOx) and volatile organic compounds. (“Volatile” refers to an extreme readiness to vaporize.) Both sets of these precursor compounds exist naturally in the atmosphere. They also occur as by-products of fossil fuel combustion at high temperatures. NOx come from coal-fired power plants, automobiles, diesel trucks and buses, farming and construction equipment, boats, and trains. Volatile organic compounds come from gasoline combustion and the evaporation of liquid fuels, solvents and organic chemicals, such as those in some paints and cleaners. Because ozone reacts easily with biological tissues, it tends to be destructive to them. Its effect on human lungs resembles a slow burn. Medical researchers have discovered that breathing ozone over several months to years at levels that are now common causes irreversible damage to the lungs of mammals in laboratories. Being mammals ourselves, we can expect respiratory impairment from overexposure to ozone. Children, seniors and all adults who exercise regularly outdoors in summer are particularly vulnerable. Plant species and ecosystems suffer from ozone as well. Productivity drops significantly in several species of important agricultural crops when ozone concentrations reach levels that are now common during the growing season in several parts of the country. To learn more about the health effects of ozone at the Earth’s surface, see the article, The Ozone We Breathe. How much more ozone are we breathing because of our fossil fuel consumption? Researchers began measuring ozone in Europe about 125 years ago,
when ozone concentrations peaked at around 10 parts per billion in a given volume of air (ppb). Although the technique of ozone measurement then
was to observe ozone’s oxidation of potassium iodide on paper (Schonbein paper) and was less accurate than current techniques, modern studies
have reexamined these procedures and concluded that we can depend on them. (Fishman, 2002) An assessment of the global rate of increase of
tropospheric ozone is difficult to determine from measurements at only a few locations, but we know that the global level has increased
significantly over the last 100 years. |
| ||
 |
European scientists measured ozone in the 1870s, and those measurements have proved reliable. Ozone concentrations at several sites in Europe then peaked at about 10 parts per billion (ppb), a small fraction of the ozone concentrations that are now common, especially at low latitudes where sunlight is most intense. Summertime ozone concentrations often exceed the U.S. 1-hour standard of 120 ppb. (Graph adapted from: Marenco et al., 1994. Evidence of a long-term increase in tropospheric ozone from Pic du Midi data series—Consequences: Positive radiative forcing. Journal of Geophysical Research. Vol. 99, No. D8, pp. 16617-16632.)
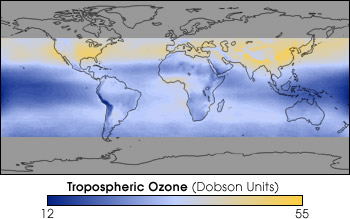
Using an interpretation of satellite data, Jack Fishman at NASA Langley Research Center developed this map of tropospheric ozone distribution in June, July, and August from 1979 to 2000. Considerably more ozone pollution exists in the Northern Hemisphere than in the Southern Hemisphere year ’round. In the three northern continents, plumes of ozone originate over the eastern portions of each landmass and travel for several thousand kilometers with the prevailing westerly winds. In low latitudes in the Southern Hemisphere, ozone concentrations are most pronounced during austral spring (September-November). Data from the EOS-Aura satellite, scheduled to launch in 2004, will move us forward to a new level in our ability to map tropospheric ozone. (Image based on data from Jack Fishman, NASA Langley Research Center.) Ozone concentrations vary widely over space and time. Generally values are highest where intense sunlight combines with extensive industrial and motor vehicle activity, and they reach especially high levels in conditions of hot, stagnant air. In the United States, high ozone concentrations occur most frequently in California, eastern Texas, the industrial Midwest, and most of the eastern states. The length of the "ozone season" (when ozone concentrations far exceed national standards) varies from one area of the United States to another. In the southern and southeastern states, it sometimes lasts nearly the entire year. The EPA reports an overall decrease in ozone concentrations of 11 percent from 1982 to 2001 (U.S. Environmental Protection Agency, 2002), largely due to regulation of industrial and vehicular emissions. But ozone levels in some parts of the country have risen, and breathing unhealthy levels of ozone is a real concern. In State of the Air 2002, the American Lung Association reports, “Three-quarters of the nation’s population who reside in areas with ozone monitors ... are breathing in unhealthy amounts of ozone pollution” (American Lung Association, 2002). According to the National Institute of Environmental Health Sciences (NIEHS), as the 20th century ended there were still 32 “non-attainment areas” in the United States, where people commonly breathe concentrations of ozone in excess of the air quality standards. (NIEHS 2000) The EPA maintains a Web site called AirNow where the public can learn about ozone levels where they live. next: Ozone Pollution Standards
|
||