From space, ocean scientists have a wide-angle view. They can see the colors of the sea (it’s not all deep blue). They can detect the intensity of plant pigments—mostly chlorophyll—in the water. They can detect the ocean surface temperatures. They can track plumes of sediment where rivers enter the ocean.
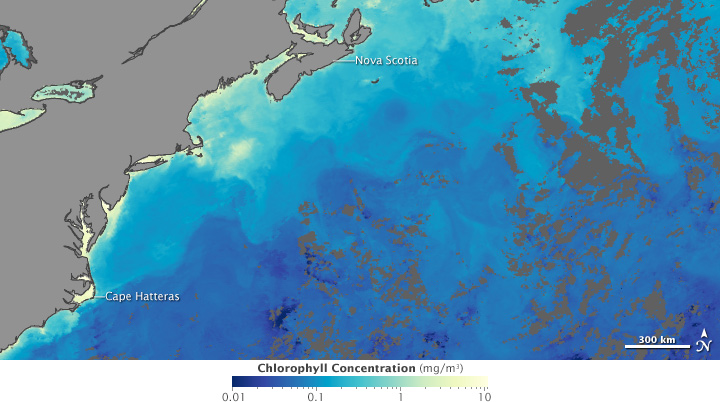
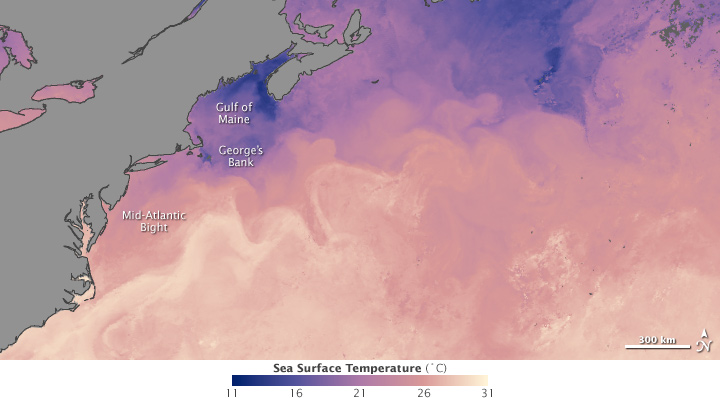
Over the past three decades, satellites have been critical for giving scientists a broad view of where and how chlorophyll-rich life is blooming in the ocean (top) and of how warm the ocean surface is. (NASA Earth Observatory images by Robert Simmon, based on data from the GSFC Ocean Color team.)
But determining what type of plankton satellites are observing—or even distinguishing plankton from other particles and dissolved substances—is tricky from space. What is happening below the surface, given that satellites can only “see” a few meters into the water?
This is why ocean scientists go to sea in ships.
From a ship, scientists can get a more detailed view of the ocean. Conductivity, temperature, and depth sensors, or CTDs, can measure physical properties of the water. Bottles mounted to these instruments can return samples that can be used to measure nutrient concentrations, water chemistry, and the presence of phytoplankton and zooplankton. Scientists can make all of those measurements from the surface to the bottom, over 5,000 meters depth in some places.
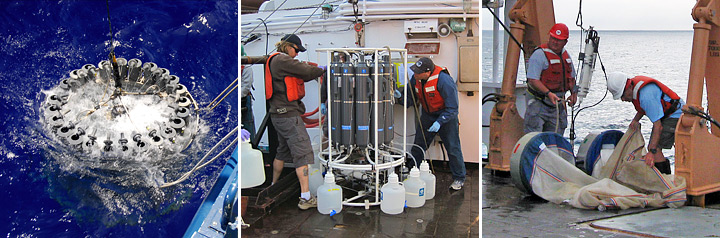
Direct sampling of the ocean with niskin bottles (left and center) and nets is the only way to measure what is happening at depth. It is also the best way to ensure the satellite view of the surface matches the reality. [Photographs © WHOI (left) and courtesy NASA/Michael Novak (middle, right).]
But they can only get snapshots of one place, at one time, and they can’t stay for long. From a ship, it is impossible to determine what’s happening at some distance away. How far does this algae bloom stretch? Is there a storm or current stirring things up over there?
This is why ocean scientists use satellites.
Fueled by the need for both a macro and micro view of the ocean, Mannino, Mulholland, and Kimberly Hyde of NOAA launched the Climate Variability on the East Coast study, or CliVEC. Through seven research cruises, three satellite data sets, and a fair amount of computer modeling, the team hopes to develop a better picture of how phytoplankton respond to seasons, weather patterns, and climate variability in the North Atlantic.
The project focuses on the waters of the continental shelf and slope from Cape Hatteras to Nova Scotia. These are some of the most biologically productive waters in the world. They are also believed to be places where more carbon goes into the ocean than comes out of it—known to climatologists as a carbon sink.
“It has been argued that the Mid-Atlantic Bight, Georges Bank, and Gulf of Maine will be particularly sensitive to climate change, given the confluence of warm waters from the south and colder waters from the north,” said oceanographer Dennis McGillicuddy of the Woods Hole Oceanographic Institution. “As global climate changes, this highly dynamic region is likely to fluctuate, teaching us valuable lessons about how ecosystems respond to changes.”
Two mighty ocean currents meet at these crossroads: the Gulf Stream and the Labrador Current. The region is also influenced by variable river discharge in the spring; cold, nutrient-rich waters welling up from the deep in the summer; warm water masses spinning off of the Gulf Stream all year; and intense seasonal stratification, or layering, between warmer and cooler waters.
Because the Labrador Current is fed by fresh water flowing from the melting glaciers on Greenland, Mannino notes, there could be profound changes in the coastal circulation patterns, biology, and chemistry of regions downstream.
