On the opposite side of the country, Takmeng Wong and his colleagues at NASA’s Langley Research Center in Virginia had come to the same conclusion. Since the 1980s, Wong has studied the most fundamental climate variable of all: the net flux of energy at the top of the Earth’s atmosphere—how much solar energy is coming in minus how much the Earth reflects and radiates as heat.

Takmeng Wong uses satellites to measure the exchange of energy between the Earth and space. (NASA photograph courtesy Langley Research Center.)
“Our team has been involved for many years in constructing time series of net flux from satellite data, going back to the 1980s,” says Wong. The observations started with a satellite mission called the Earth Radiation Budget Experiment and today are being made with Clouds and the Earth’s Radiant Energy System (CERES) sensors on NASA’s Terra and Aqua satellites.
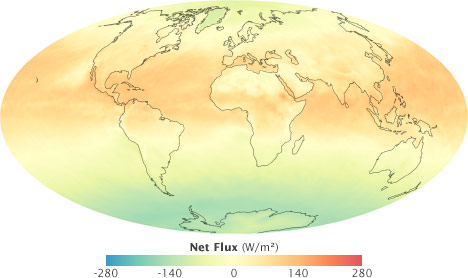
Net flux is the difference between the energy absorbed by the Earth and the energy the Earth reflects or releases as heat. If net flux is positive (red), more energy is coming in than is going out. Most of the excess energy is stored by the oceans. (Map from NASA Earth Observations, based on Flashflux data.)
Wong and his teammates’ record of net flux measured by NASA satellites shows that between the mid-1980s and the end of 1990s, the amount of incoming and outgoing energy at the top of the atmosphere crept out of balance. By the end of the period, about 1.4 watts per square meter more energy was entering the Earth system than leaving it.
Stitching the observations from multiple sensors into a coherent long-term record is complicated. Scientists are always looking for ways to check the accuracy of these pieced-together climate records. Since the ocean is the planet’s single biggest reservoir for surplus energy, the energy imbalance Wong and his colleagues detected in net flux observations ought to be detectable in ocean heat content, too. The connection between these two related, but independently measured vital signs of Earth’s climate brought Wong and Willis into collaboration in 2006.
“When Josh Willis published his first global estimates of ocean heat storage, we saw it as a chance to verify the accuracy of our energy balance time series against a completely independent set of measurements. Josh gave us data on ocean heat storage through 2002, and we compared it to our net flux estimates. There was good agreement, and so we published a paper on that together.”
“We continued to update our net flux time series each year, and we concluded that the positive energy imbalance that we detected previously remained the same,” says Wong. So he was surprised, even a little alarmed, when Lyman and Willis’ reached the opposite conclusion in 2006, saying that the ocean had cooled.
From 1993 to 2003, measurements of heat storage in the oceans agreed with satellite observations of net flux. After 2003, however, surface observations suggested that the ocean was losing heat, while satellite measurements of net flux showed the Earth was still slowly gaining energy. This mismatch was a hint that there might be a problem with one of the data sets. (Graph courtesy Takmeng Wong, NASA Langley Research Center.)
Willis admits the results were puzzling, but the apparent contradiction didn’t automatically convince him the ocean heat data were wrong. A large pulse of melt water from glaciers and ice sheets might account for a rise in sea level even as the ocean cooled and contracted.
The possibility that melting during the period had been large enough to offset a sea level drop became more remote later in 2006, with the release of several studies based on data from NASA’s Gravity Recovery and Climate Experiment, or GRACE, mission. Launched in 2002, the GRACE mission measures changes in Earth’s gravitational field over space and time. Changes in the gravity field are a sign that mass has shifted from one location on Earth to another, like the transfer of water to the ocean when ice sheets and glaciers melt.
When scientists began analyzing the first few years of GRACE data, they concluded that Greenland and West Antarctica were definitely melting and contributing to a rise in sea level. But, says Wong, “The amount did not seem to be enough to offset a cooling as large as they had reported.”
“We let Josh know, diplomatically of course, that all signs were pointing toward his data,” says Wong.
“I was aware that they were not seeing this huge cooling that we were seeing in the ocean,” says Willis. “In fact, every body was telling me I was wrong. And there were always doubts,” says Willis. “After all, it was a very surprising result. As a scientist, its part of my job to turn over every leaf. So I was constantly going back over the data and looking for problems.”
For nearly a year after the 2006 ocean cooling paper was published, nothing obvious turned up. It wasn’t until that next year of data came in that the cooling in the Atlantic became so large and so widespread that Willis accepted the cooling trend for what is was: an unambiguous sign that something in the observations was “clearly not right.”
