 |
by David Herring · September 25, 2000 After the “dust bowl” years of the 1930s—in which much of the Great
Plains region of North America suffered extreme drought conditions for
years with devastating economic consequences—overall climate conditions
have grown wetter with each passing decade. Station rain gauge records
around the world reveal that over the last century annual precipitation
has increased by about 2.4 mm per decade, on average, with much of the
increase concentrated in North America (Dai et al. 1997). |
|||
But despite the general increase in rainfall, in almost any given year meteorologists can point to a region on the map that experienced drought. Precipitation patterns can vary widely on regional scales, from one season to the next, and from year to year. It is hard to predict accurately where and how much rain will fall next week. It is harder still to forecast next year's rainfall patterns. Consider, from 1995 to 1996, the northwestern and northeastern regions of the U.S. received higher than normal rainfall amounts, while precipitation in Alaska, eastern Canada, and the central and southwestern U.S. was substantially below normal (Bell and Halpert 1997). Then, from January through the summer of 1998 there was excessive rainfall in California and across much of the central and southern United States, while the Gulf Coast states and Mexico experienced severe drought (Bell et al. 1998). In the summer of 2000, drought hit hard in southeastern states like Georgia and Alabama while much of Texas has gone more than 67 consecutive days without rain. An increasing number of scientists say we are in for more extreme "wet" and "dry" events, and we can expect them more often as average global temperatures rise (Dai et al. 1998).
|
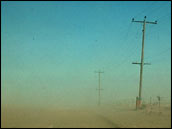 Severe droughts kill crops, shrink lakes, and dry topsoil until it is carried away by the wind. The resulting dust storms can damage many things in their path, and carry away valuable plant nutrients. (Photograph courtesy U.S. Department of Agriculture) | ||
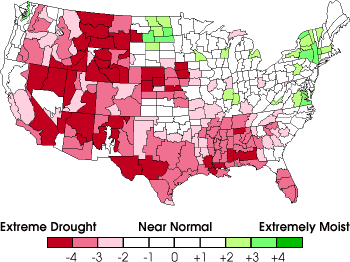
Poring over data from satellite remote sensors, ground-based rain gauges, shipborne measurements, and even historical samples taken from sediment strata in dried rivers and lakebeds, researchers are painstakingly piecing together a picture of dry spells in North America. Where and how often do droughts typically occur, and with what intensity? And, perhaps most important, what causes them? The goal is to use these new data to construct computer models that will help scientists predict the onset of a drought weeks, months, or even a year ahead of its arrival. | summer 2000 animation (1.3MB) A sophisticated system for measuring drought was developed by National Weather Service meteorologist Wayne Palmer in 1965. Called the Palmer Drought Severity Index, it uses temperature and rainfall information in a formula to determine dryness. This index is now the semi-official indicator of drought. The Palmer Index is most effective in determining long-term drought (a matter of several months) and is not as effective with short-term forecasts (a matter of weeks). The index uses a 0 as normal, and drought is shown in terms of negative numbers; for example, -2 is moderate drought, -3 is severe drought, and -4 is extreme drought. In mid-August 2000, sections of many western states were in the -4 range. [Image courtesy National Oceanographic and Atmospheric Administration (NOAA)] |