 |
by Jason Starr January 4, 2000 |
||
|
Scientists who wish to have their fingers on the pulse of global climate change need to know what is going on with polar ice caps. The melting and freezing of polar ice is one of the best barometers of the global climate. Because the ice that blankets Greenland sits at a lower latitude than other polar ice caps, scientists expect it to show the effects of global climate change first.
|
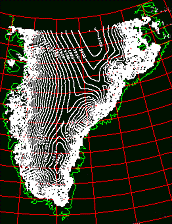 (Image courtesy of National Snow and Ice Data Center) Spatial coverage map of the Greenland Ice Sheet using SEASAT and GEOSAT altimetry. 
For more information, visit the National Snow and Ice Data Center DAAC. (A new browser window will open.) |
Jet Propulsion Laboratory senior researcher Mark Drinkwater, along with Brigham Young University professor David Long, realized the importance of the Greenland ice sheet and, in 1989, began building a complete picture of the island's changing ice conditions.
About 80 percent of the surface of Greenland is covered by the ice sheet, 45 percent of which is dry snow (high-altitude snow that remains frozen all year). Between the narrow strip of dry land exposed along the coast and the dry snow zone at the highest altitudes, is the area of melting that concerns Drinkwater and Long. Using a combination of radar scatterometer data and the continuous data record created by passive microwave radiometer instruments managed by the National Snow and Ice Data Center, Drinkwater and Long have pieced together the annual fluctuations of the Greenland ice sheet since 1978. What they have seen is a general trend toward increased melt and a shrinking of the dry snow zone in the middle. "Every year, the line around the fringe of the ice sheet where melting occurs has been creeping up slope further and further," Drinkwater said. "In the recent past, we appear to have lost up to 20 percent of the dry snow zone." Drinkwater and Long headed a team at JPL that looked back at data from the Seasat scatterometer, which, at the time it flew was used only to measure wind speed over the ocean. They used these data to piece together a snapshot of the Greenland ice cap as it looked in 1978. Unfortunately, the Seasat satellite failed after only three months in flight. Eighteen years later, NASA launched another scatterometer called NSCAT. The NASA scatterometer was carried aboard a Japanese satellite called ADEOS-I, which failed prematurely after only one year in orbit. So the record of Greenland's ice cap using scatterometry has an 18-year gap bookended by short segments of data from 1978 and 1996/97. However, in the intervening years, the National Snow and Ice Data Center had been recording activity on Greenland's ice sheet using passive microwave radiometry. These data, however, is of lower resolution and more prone to interference from a moist atmosphere than that of the longer wavelength scatterometer, said Drinkwater. Nonetheless, when passive microwave data are combined with scatterometer data, the record is complete. The European Space Agency began playing a role in the monitoring of Greenland's ice sheet in 1991 when it launched the first Earth Remote Sensing satellite. (It launched a follow-up mission in 1994.) The ERS satellite carries a scatterometer that uses a different frequency than that of NSCAT. "There are tradeoffs in what we can do with it," Drinkwater said. "It gives us a slightly different capability, but we make, nevertheless, the same style of images. They are not the same quality as you would get with an NSCAT kind of an instrument due to the sampling characteristics of ERS. "The real power comes from having the two satellites in orbit at the same time because they have different frequencies. They are looking at slightly different characteristics of the ice sheet, and they help to resolve features on the surface in a very complementary fashion." In November 1998, NASA launched Quikscat, a scatterometer with similar capabilities as NSCAT. Now, two scatterometers with different frequencies — ERS-II and Quikscat — collect data simultaneously. In conjunction with passive microwave instruments, these scatterometers provide Drinkwater and Long with the most complete view of Greenland yet. Scatterometers were originally developed to measure wind speed over the ocean. Drinkwater, who had been studying features of snow and ice sheets using microwave radar altimeter data for his Ph.D. in 1984, began searching for a way to get a more complete picture of the ice on Greenland. "My main interest was to try and see if we could use the lower resolution info which comes from scatterometers to be able to create an image of large features such as continental ice sheets," he said. The scatterometer data allow Drinkwater and Long to get a broad view of Greenland's ice as opposed to piecing together the 100-kilometer images ERS produces. "Now we have an entirely different perspective of the ice sheet because we can look at a much bigger area at one time," Drinkwater said. "The scatterometer was never conceived of as being an instrument that was useful for making images. We are doing something very different with the data than originally planned." From orbit, the scatterometer pulses a wave to the surface of Greenland, and, within a few milliseconds, a scattered wave reflects back to the satellite. The satellite then records the strength of the received wave, which is a fraction of the power of the original wave. That fraction tells scientists about the scattering characteristics of the surface. A melting surface reflects a lot less of the original beam than a dry snow zone. "Wet melting surfaces look dark in the images because very little energy gets scattered back from those regions," Drinkwater said. "The area of the melting is therefore very clearly defined." In this way, Drinkwater and Long have been able to produce images of the Greenland ice sheet as the extent of melting grows and shrinks. Everyone wants to ask whether the warming trend in Greenland can be attributed to a general warming of the globe. Drinkwater and Long are certainly in the position to see the first effects of global warming, however, they are not ready to blow the whistle. "We don't know if this particular cycle is normal, unusual or caused by man," Long said. "It may be man-caused, at least in part, but nobody can say that with any degree of certainty. But it would make sense to take some precautions to avoid making the situation worse. "The potential consequences of a continuing warming trend could be disastrous to human kind but we can't be certain. I personally believe the climate really is warming up and that we are heading into an era of continued climate change." According to Long, the world's weather is presently at a high level of oscillation. Virtually all the major records in weather conditions this century have occurred in the last ten years, he said. These radical fluctuations are the precursor for any system to undergo a major change. "Right before a system goes unstable it tends to bounce around and oscillate," Long said. "We may be reaching a point where we will get a change in climate." Drinkwater is a bit more cautious than his colleague with the question of global warming. "I'd like to see a consistent data set built from these scatterometers over the next fifteen years or so. Then perhaps we can make a judgement call," he said. |
|
