The new top-to-bottom view of the ice should help fill in the gaps in understanding why ice on land moves the way it does. Seeing the ground beneath the ice reveals why some areas are thinning rapidly, while others are holding steady. A smooth surface or water at the base of a glacier allows it to slide quickly, channeling large quantities of ice from the interior of an ice sheet to the ocean. A rough bed surface can anchor a glacier in place.
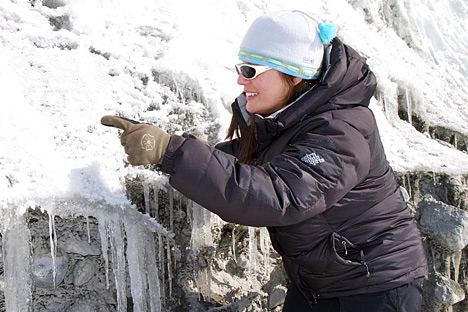
Lora Koenig, a NASA scientist, examines the contact between southern Greenland’s Russell Glacier and the ground. The interactions between ice, rock, and water govern how fast glaciers flow. (Photograph courtesy NASA IceBridge.)
The shape of the land where a glacier meets the ocean influences how the glacier will behave, says Nowicki. If the ground slopes downhill as you move inland from the ocean—or if the glacier is channeled through a deep canyon or fjord—then it’s a sure bet that the glacier will retreat quickly. In contrast, bumps or ridges beneath the glacier can act as pinning points and stop the retreat.
Glacier bed measurements from IceBridge are already improving the models for two important glaciers, Jakobshavn Isbrae in Greenland and Pine Island Glacier in Antarctica. Both are fast-flowing glaciers that channel vast amounts of ice into the ocean.
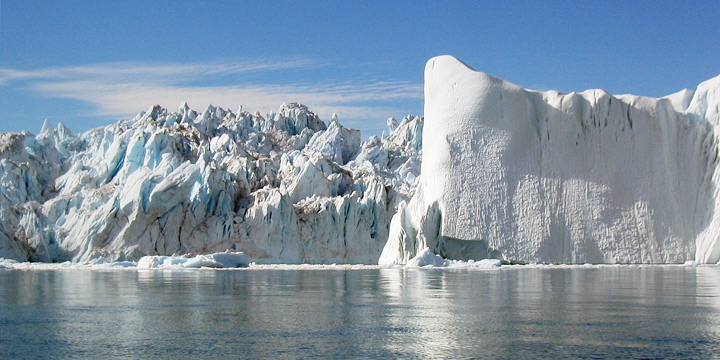
Jakobshavn Isbrae is the largest outlet glacier in Greenland, and affects the rate of ice loss from the Greenland Ice Cap. (Photograph copyright Spencer Weart, American Institute of Physics.)
“Before IceBridge, this measurement of Jakobshavn was the best bed we had,” says Nowicki, pointing to a crude figure (image below left) illustrating what was once the best picture of the ground beneath any glacier. “With much more data from the radar instrument (on IceBridge and earlier flights), we realized that the bed of Jakobshavn Isbrae is a channel that could be compared to the Grand Canyon. It’s the same width, the same depth.” Ice-flow models that use the new measurements of the Jakobshavn bed now match pretty closely with the real-world observations of its movements.
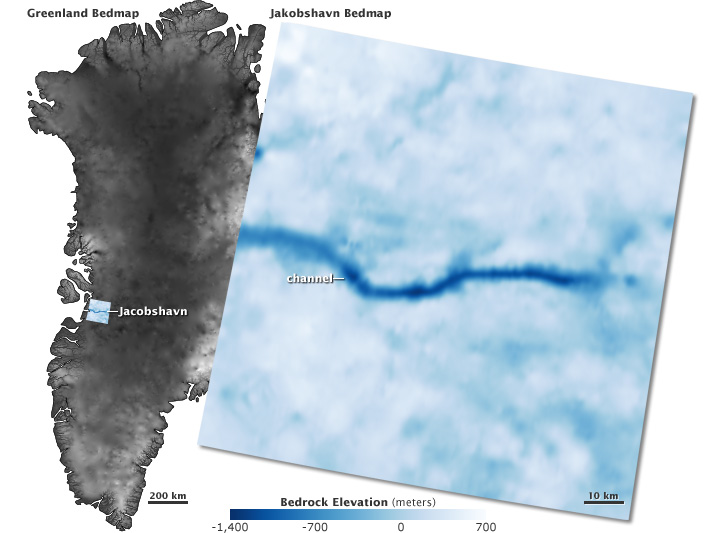
Before NASA’s intensive field studies, maps of the bedrock beneath Greenland’s Ice Cap had a maximum resolution of about 5 kilometers per pixel (left image). New maps improve that twenty-fold, to about 250 meters per pixel (right). (Map by Robert Simmon, using data from the Bristol Glaciology Centre and the Center for Remote Sensing of Ice Sheets.)
The models of Pine Island Glacier are improving as well. “The Pine Island Glacier and its neighbors are the most important glaciers in Antarctica,” says Rignot. “They are losing an enormous amount of mass.”
The end of the Pine Island Glacier hangs and floats over Pine Island Bay, and this poses a challenge for radar instruments that would otherwise image the ice from top to bottom. “Radar systems don’t penetrate water,” says Studinger.
Scientists knew that they needed to figure out the shape of the ocean floor beneath Pine Island Glacier because it controls the flow of water in the bay. And so the IceBridge team installed a gravimeter on the plane to measure variations in gravity. Because rock is denser than water, the gravity field over rock is a bit stronger. These minute variations allowed scientists to piece together a rough map of the ocean floor.
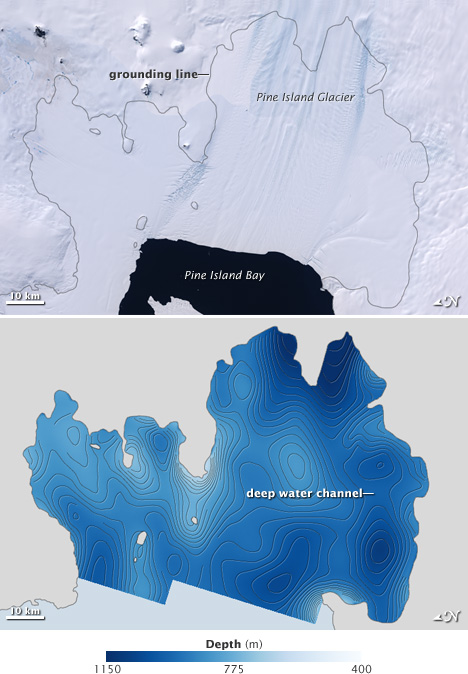
Flow of the Pine Island Glacier is guided by the shape of the sea floor beneath the ice. Gravimeter measurements made in October 2009 revealed a deep channel leading from the Antarctic coast to Pine Island Bay. (Image by Jesse Allen, using data from Michael Studinger, NASA GSFC and Columbia University.)
“The bathymetry explains right away why Pine Island Glacier is melting,” says Studinger. A deep channel snakes from the front of the glacier to the grounding line, where the land connects to the ice and holds it in place. Warm water has been reaching the grounding line and undercutting the glacier, forcing it to move and melt quickly.
“When we put this data into the ocean circulation models, they suddenly made sense,” says Studinger. “The melt rates that they produce are very close or almost identical to the melt rates that we are observing.”
