NASA Missions to Study HurricanesThe ability to detect and track severe storms has been dramatically enhanced by the advent of weather satellites. Satellites have also helped scientists understand the mechanisms that drive hurricane formation and development. In its mission to study the Earth, NASA has developed and launched several innovative satellites that are providing unprecedented information on hurricanes. QuikSCATNASA’s Quick Scatterometer (QuikSCAT) spacecraft was launched from Vandenberg Air Force Base in California on June 19, 1999. QuikScat carries the SeaWinds scatterometer, a specialized microwave radar that measures near-surface wind speed and direction under all weather and cloud conditions over the Earth’s oceans. Data from the SeaWinds scatterometer augments traditional satellite images of clouds by providing direct measurements of surface winds. Scientists can compare the winds with the observed cloud patterns in an effort to better determine a hurricane’s location, direction of motion, structure, and strength. Specifically, these wind data are helping meteorologists to more accurately identify the extent of gale-force winds associated with a storm, while supplying inputs to numerical models that provide advanced warning of high waves and flooding. QuikSCAT’s measurements of near-surface wind direction also help scientists answer questions about hurricane formation and evolution. For example, QuikSCAT wind measurements reveal when circulation first forms at the surface. In the earliest stages of tropical cyclone formation, winds start to circle around a low-pressure region at a mid-level in the atmosphere. When that circulation reaches the bottom of the storm, immediately above the ocean, the circling winds kick up the water vapor from the ocean needed to fuel the storm into a full-blown hurricane. As the only instrument that currently measures wind direction at the surface, QuikSCAT can reveal when a storm’s winds have reached the surface, allowing scientists to study this crucial stage of hurricane evolution. TRMMThe Tropical Rainfall Measuring Mission (TRMM), a joint project of NASA and the Japanese Space Agency, is the first space mission dedicated to studying tropical and subtropical rainfall. The satellite launched on November 27, 1997, from the Japanese Space Center in Tanegashima, Japan. TRMM carries a suite of advanced instruments that includes the world’s first spaceborne Precipitation Radar, the TRMM Microwave Imager, the Visible and Infrared Scanner (VIRS), the Clouds and the Earth’s Radiant Energy System (CERES), and a Lightning Imaging Sensor (LIS). Scientists are using the Precipitation Radar and the Microwave Imager to peer inside the tropical thunderstorms associated with hurricanes to understand how precipitation is organized in hurricanes and how that organization relates to storm intensity and environmental effects. This information is adding to the knowledge needed to improve computer-based weather models. With these data, meteorologists may be more able to precisely predict the path and intensity of hurricanes. For example, the Precipitation Radar detects both the horizontal and vertical structure of rain in a storm, giving scientists an unprecedented three-dimensional view of hurricanes. This view has revealed that hurricanes often produce deep, towering clouds of heavy rain just before intensifying. The presence of tall towers in TRMM data can help forecasters improve their predictions of storm intensification. 
Scientists gained an unprecedented view of hurricanes with QuikSCAT and TRMM data. QuikSCAT measures wind (arrows) while TRMM measures rainfall (color). The two satellites observed Cindy on August 25, 2000. The storm reached Category 4 strength, but never threatened land. (Image courtesy Seaflux, NASA/JPL.) In addition to providing clues about storm intensity, TRMM reveals the storm’s structure. Since the heaviest rain clusters around the center of a cyclone’s circulation, the precipitation patterns show where the center of a storm is located well before an eye can be seen in photo-like satellite images of clouds. Knowing exactly where a storm’s center is located helps forecasters improve their predictions of where the storm will go. On a broader scale, TRMM data are being used to answer the question of how the latent heat released during condensation of water vapor into raindrops affects global weather patterns. Together, QuikSCAT and TRMM are providing scientists with the opportunity to observe a hurricane’s wind and rain before it makes landfall. The coincident measurements of surface wind and rain reveal the interplay between precipitation processes and surface energy exchanges within the storm. These variables are important in understanding the structure of the hurricane and predicting its path. AquaCarrying a suite of six instruments for observing Earth’s oceans, atmosphere, land, ice and snow, and vegetation, Aqua was launched on May 4, 2002, from Vandenberg Air Force Base, California. Four of the instruments collect information valuable to hurricane research. The Advanced Microwave Scanning Radiometer for EOS (AMSR-E) measures sea surface temperatures by recording microwave energy emitted from the Earth. Warm ocean waters fuel hurricanes, so measurements of sea surface temperatures are crucial to accurately predicting how much a storm might intensify. Because microwave energy passes through clouds, the sensor can record sea surface temperatures both in the hurricane’s path and directly beneath the storm, something previous satellites, which used infrared light to detect temperature, could not provide. These measurements reveal the cold water wake created when hurricanes churn up a shallow layer of warm water allowing cooler, deep water to come to the surface. This interaction between the storm and the ocean’s surface is visible immediately in ASMR-E microwave data, but can only be seen after the storm passes in infrared-based sea surface temperature measurements. AMSR-E also provides information on the precipitation structure of hurricanes similar to the TRMM Microwave Imager. By combining precipitation information from the TRMM Microwave Imager, AMSR-E, and other satellites, scientists are able to monitor changes in the precipitation structure of storms and to estimate the total rainfall occurring along the path of the storms. 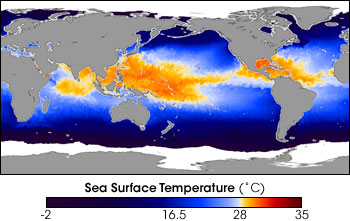
Warm water provides the heat that fuels a hurricane, and ocean water retains its heat after air temperatures begin to cool in late summer. Water remains especially warm along the equator, and some of the warmest water occupies the Gulf of Mexico. This image shows sea surface temperatures on September 16, 2006, as recorded by the Advanced Microwave Scanning Radiometer - EOS (AMSR-E). Locations where waters were generally warm enough to support hurricanes are gold or red, while areas too cool to support hurricanes are blue. AMSR-E’s microwave technology allows it to measure sea surface temperature through clouds. (Image by Jesse Allen, NASA GSFC.) Three additional instruments on Aqua provide information about atmospheric conditions. The Atmospheric Infrared Sounder and the Advanced Microwave Sounding Unit work together to give temperature and humidity profiles of the atmosphere. Data from the Moderate Resolution Imaging Spectroradiometer can be used to measure atmospheric water vapor, aerosols, and clouds. Taken together, this information about the atmosphere is helping scientists understand what influences hurricane formation and development. CloudSAT and CALIPSOLaunched together from Vandenberg Air Force Base in California, on April 28, 2006, CloudSat and CALIPSO fly in close formation to provide nearly simultaneous, three-dimensional measurements of cloud structure. CloudSat carries the first satellite-based, millimeter-wavelength cloud radar—a radar that is more than 1000 times more sensitive than existing ground-based weather radars. The radar sends out radio waves and records their return to determine the location of tiny particles of water and ice that make up clouds. CALIPSO, for Cloud-Aerosol Lidar and Infrared Pathfinder Satellite Observations, similarly uses laser light pulses to measure the location of ice, water, and aerosol particles. By plotting the location of particles, scientists get an unprecedented two-dimensional view of a cloud’s structure. One of the questions that NASA scientists are trying to answer with data from the Aqua, Cloudsat, and CALIPSO satellites is what impact warm, dry, dusty air blowing out of the Sahara Desert might have on hurricane formation in the Atlantic. Does the dry air suppress hurricane formation, or does dust provide seeds for clouds, prompting storm formation? Together, the three satellites reveal humidity, aerosols (dust), temperature, and cloud structure within the layer of Saharan air, which allows scientists to map out these characteristics of the air mass in relation to where and when hurricanes form. By understanding where Saharan air is in relation to hurricanes, scientists can then observe what impact the air might have on storms. Field CampaignsSupplementing satellite observations, NASA has conducted a number of field campaigns, which use aircraft and ground-based instruments to get a more detailed view of hurricanes. Field studies generally look at focused questions such as why do towering clouds lead to intensification, or how does the wind structure at various points in the storm change as a cluster of thunderstorms transitions into a full-blown hurricane. In field studies, scientists fly aircraft carrying an array of radar and other instruments over or within a storm. The instruments measure rain structure, temperature, humidity, and winds directly under the plane, giving a very detailed view of a slice of the storm. Satellites (with the exception of CloudSat and CALIPSO), by contrast, show a wider area in less detail. 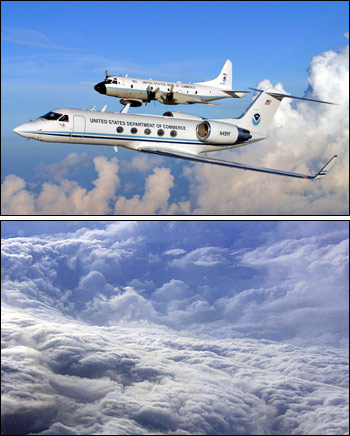
Scientists take advantage of hurricane-hunting aircraft to study hurricanes from close vantage points directly over the storm. NOAA’s hurricane-hunting aircraft WP-3D Orion and Gulfstream IV fly in tandem to take detailed measurements (top). On August 28, 2005, one day before Hurricane Katrina made landfall, a NOAA employee photographed the storm’s eyewall from the P-3 hurricane-hunter aircraft (bottom). (Images courtesy NOAA.) ModelsWhile satellite and field observations are essential to understanding hurricanes, it is impossible to observe all of a storm in complete detail throughout its lifetime. Weather satellites that have a constant view of storms provide distant, low-resolution pictures. Satellites that capture the storm in greater detail and aircraft see the storm only when they fly over it. To fill in the gap, scientists use observations as input to computer models, mathematical descriptions of the atmosphere or storm. Some models focus on a very small scale, looking at the processes within individual hurricanes, while others focus on a global scale, looking at global ocean and atmosphere conditions in relation to storm formation. Not only do the models allow scientists to look at what might be happening in a storm moment by moment, but they also allow scientists to experiment. In a model, you can change the amount of dust in the Saharan air layer, for example, or the circulation of air inside a storm, and see what effect the change has on the storm. By combining models with field and satellite data, NASA scientists are working to more fully understand the structure and mechanics of hurricanes and the large-scale climate patterns that influence them.
back: Hurricane Climatology
|
| ||