The signature of drought was easy to read in the southern United States in the summer of 2011. It was in the brown, wilted crops and the bare fields. It was in the clouds of dust that rolled across the sky and in the shrinking reservoirs. It was in the fires that raced through crisp grasslands and forests, devouring homes and wilderness. It was in the oppressive heat that returned day after day.
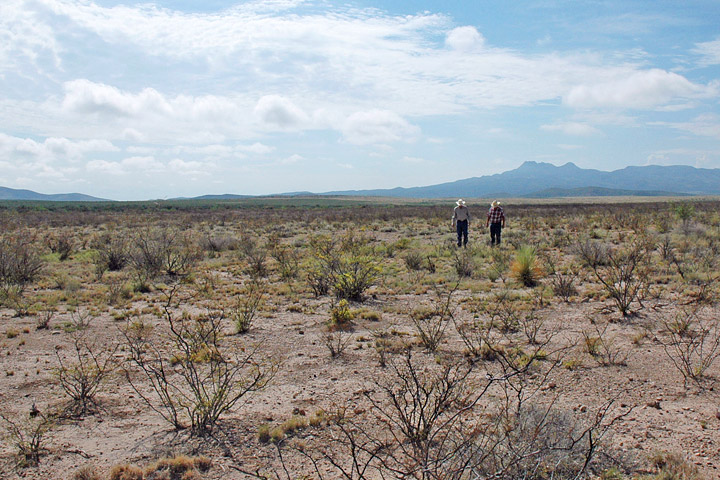
Two ranchers walk across the plains of drought-stricken West Texas in July 2011. (Photograph courtesy U.S. Department of Agriculture.)
Drought was harder to see as 2011 drew to a close. With the return of winter, rains began to fall and temperatures dropped. But the drought was still there, lingering beneath the surface. It was still apparent to hydrologists who test the wells that plunge deep into underground aquifers.
This lingering, subtle drought was also visible to a highly unusual pair of satellites.
In Nebraska, Brian Wardlow and colleagues at the National Drought Mitigation Center watched the drought long before and after the average citizen paid heed. Wardlow develops satellite-based products that experts use—along with more traditional ground observations—to assess the severity of drought. Looking at measurements from the satellites, Wardlow could see broad-scale changes in groundwater supplies at varying depths over large swaths of the South.
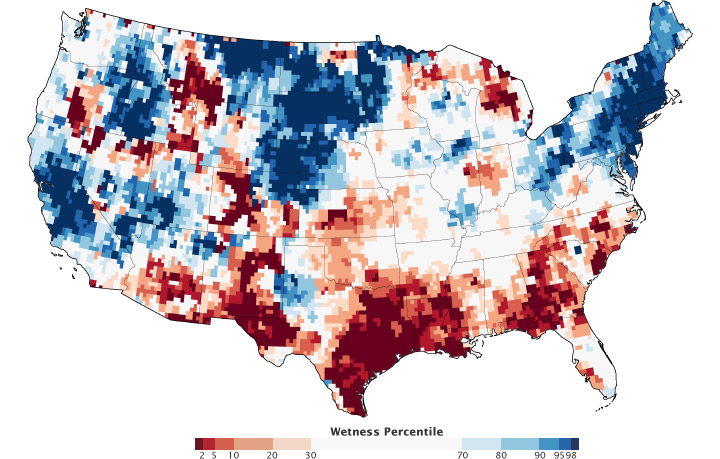
Measurements of underground water storage (aquifers)—rather than surface water (lakes, rivers, etc.)—reveal the long-term effects of drought. This map shows ground water conditions in the U.S. during the week of November 28, 2011, compared to the long-term average. A time-series animation shows the evolution of ground water from 2002 to 2012. (Map by Chris Poulsen, National Drought Mitigation Center, based on data from the GRACE science team.)
After a year without much rain, it was no surprise that the drought lingered below the land’s surface. “Groundwater takes a long time to be depleted, but it takes a long time to be recharged as well,” says Wardlow, a remote sensing specialist at the University of Nebraska–Lincoln. From experience, he expected regional groundwater supplies to be diminished. But this time he could see it in greater detail than traditional well measurements had ever provided.
Observing the water buried beneath layers of soil and rock was no small thing. When the twin satellites known as the Gravity Recovery and Climate Experiment, or GRACE, were launched in March 2002, few hydrologists believed they could see—no less measure—changes in groundwater. But at least two scientists did: Jay Famiglietti and his graduate student Matt Rodell, who were working at that time at the University of Texas at Austin (UT-Austin).
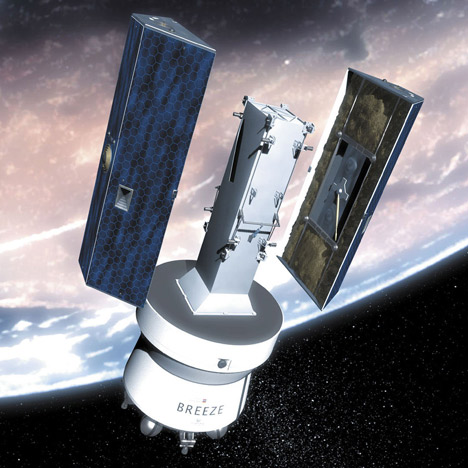
The twin GRACE satellites launched on March 17, 2002, aboard a Russian rocket. (Image courtesy NASA JPL.)
Now a scientist at NASA’s Goddard Space Flight Center, Rodell has spent the past decade studying groundwater with GRACE and working to make those measurements useful to decision-makers. Thanks largely to Famiglietti, Rodell, and a handful of other scientists, GRACE’s measurements of groundwater, ice, and oceans are now so essential that NASA is preparing to launch a follow-on mission.
“Hydrologists were slow to embrace GRACE because its data were unlike anything they had ever seen before,” says Rodell. GRACE isn’t a probe that can be buried in the ground to measure water directly. It isn’t even a standard satellite that takes pictures of the ground.
In fact, raw data from GRACE are nothing but a series of measurements showing how far apart two satellites are. The twin satellites follow each other in orbit around the Earth, separated by 200 kilometers (120 miles) or so. They constantly send microwave signals to each other to measure the distance between them.
On a more sophisticated level, GRACE measures gravity, the force that anchors us to the planet. Gravity is an attraction between two objects—such as a human and the Earth—and its strength varies depending on how much mass those objects have and how far apart they are. For example, the tug of gravity is weaker for a person on the Moon than on the Earth because Earth is more massive.
“GRACE is not looking at the ground,” says Famiglietti, now at the University of California-Irvine. “It’s feeling the ground.”
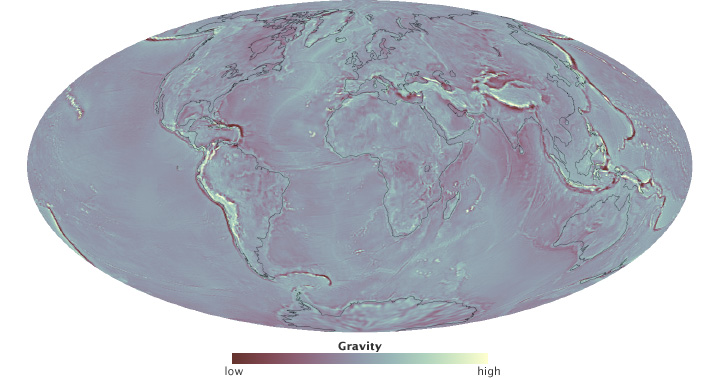
Earth’s gravity varies from place to place, determined in part by elevation, the thickness of the crust, and the density of different substances. (NASA map by Robert Simmon, using data from the International Centre for Global Earth Models)
Our senses perceive gravity as constant on Earth, but it actually varies slightly from location to location; it also changes as mass shifts. When the GRACE satellites encounter a change in the distribution of Earth’s mass—say a huge blanket of fresh snow on California’s Sierra Nevada—they are pulled toward the mountains a tiny bit more than normal. The leading satellite responds first, changing the distance between the two satellites. Instruments on the satellites record this change in separation to within one-one hundredth of the width of a human hair. By tracking trends in how the satellites’ orbits change, scientists and engineers can calculate how gravity is changing on Earth.
So when groundwater supplies dwindled in the southern United States in 2011, that region of the planet had a little less mass. The satellite orbits moved a bit in response. GRACE data revealed the change in groundwater storage to Wardlow.
The measurement of gravity by satellite is as old as the Space Age, notes Srinivas Bettadpur, GRACE’s science operations manager at UT-Austin. Early engineers, including GRACE principal investigator Byron Tapley (UT-Austin), detected variations in satellite orbits that could only have been caused by variations in gravity.
“The first thing I tackled in the 1970s was the task of computing the orbits of satellites very accurately to support satellite altimeter missions,” says Tapley. “We reached the point that we could compute orbits that had an accuracy of a few centimeters.” Eventually his computations hit a glitch that he couldn’t fix. The satellite orbits varied seasonally.
Tapley and others realized that these subtle shifts in Earth’s gravity occurred primarily because water moves from one place to another on and under land, in the ocean, and in the atmosphere. In the early days, Tapley’s orbital variations could capture movement on the scale of a hemisphere. But no one could measure the subtle, tiny shifts accurately enough to map Earth’s gravity in fine detail.
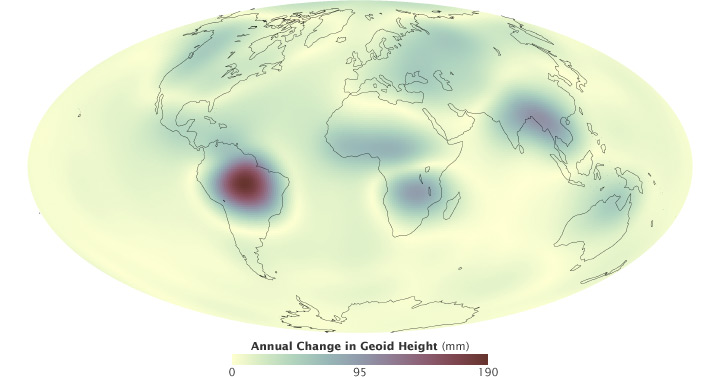
GRACE measures the Earth’s gravity precisely enough to map the seasonal movement of water. This image shows the yearly change in the Earth’s geoid. The biggest variations occur in the Amazon, followed by other areas with large changes in rainfall between wet and dry seasons. (NASA map by Robert Simmon, using data from the University of Colorado Real-Time GRACE Data Analysis Site.)
“When we first proposed GRACE, there was a lot of concern about how well we could determine where the gravity signal is coming from,” says Michael Watkins, the GRACE project scientist at NASA’s Jet Propulsion Laboratory (JPL). “Could you easily see the difference between a reservoir in North America versus ice melt in Greenland versus ocean circulation? We did a lot of simulations to convince folks that we could.”
GRACE is able to make accurate measurements thanks in part to two advanced technologies: a microwave ranging system based on Global Positioning System (GPS) technology, and a very sensitive accelerometer—an instrument that measures the forces on the satellites besides gravity (such as atmospheric drag).
The microwave ranging technology came from NASA’s Deep Space Network, designed by engineers in Watkins’ group at JPL. “The antennas on GRACE are based on the design of the antennas that track spacecraft at Mars and Jupiter,” says Watkins. The new ranging system was so accurate that an antenna on each satellite could allow it to track the other’s minutest movement. GPS satellites and receivers on the ground provided additional measurements of the satellite locations.
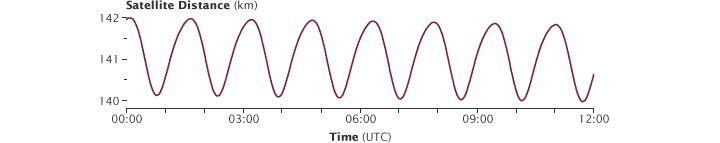
During each 95-minute orbit, the distance between the GRACE satellites varies by about 2 kilometers (1.2 miles). Instruments aboard the satellites measure the separation to a precision of one micrometer (0.00004 inches). (NASA graph by Robert Simmon and Kevin Ward, using GRACE data from the JPL Physical Oceanography DAAC.)
The accelerometer measures the forces that move the satellite by pushing on its surface. “The measurement allows us to correct for anything that is related to drag or solar pressure, leaving just gravity,” says Watkins.
Together, these very precise measurements of location, force, and orbital change translate into an observation of gravity with unprecedented accuracy. Unlike most satellites, which are put in a carefully controlled orbit, the GRACE satellites were launched into a high orbit and then largely left alone. Flight engineers only maneuver the satellites if they separate by more than 250 kilometers. As the satellites circle the Earth, the ranging technology tells scientists exactly where each satellite is relative to the other. Supercomputers and scientists compare the positions of the satellites relative to each other and to previous orbits, noting every variation.
To relate changes in satellite motion to changes in gravity, Bettadpur and his team start by examining what the satellites’ paths ought to look like. They know where the mountains are, and where the oceans grow deep. They know the path of the Sun and the Moon, and the related fluctuation of ocean tides. They know what large weather systems have moved through the atmosphere. And they can determine how much all of these things should pull on the satellites.
The researchers use mathematics and fundamental laws of physics to translate measurements of the satellite paths into measurements of gravity, and the equations are as old as Isaac Newton. Sir Isaac invented calculus to solve his equations; the GRACE team needs a supercomputer. Located at the Texas Advanced Computation Center, a supercomputer crunches billions of arithmetic operations on half a million new observations collected every month. The end result is a single set of numbers that represent how much gravity has shifted compared to previous months.
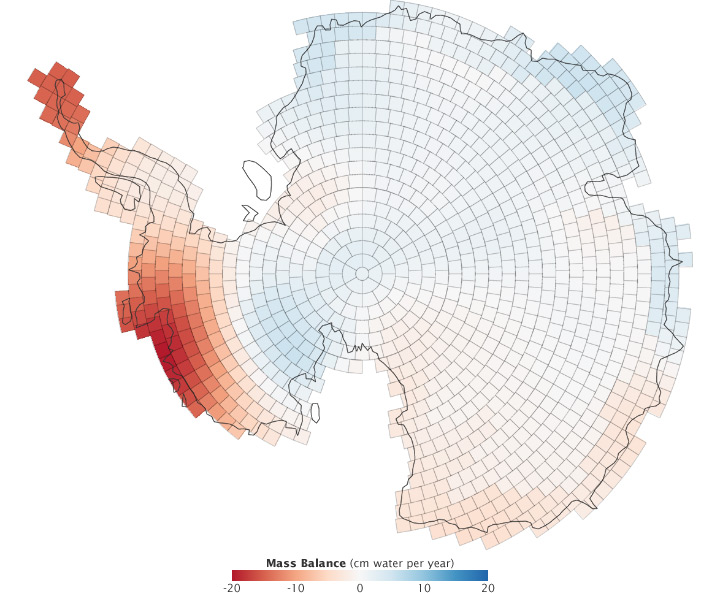
GRACE measured changes in the Antarctic ice sheet from December 2003 through 2010. Red areas lost mass, while blue regions gained mass. (NASA map adapted from Luthke et al., 2012.)
“The distance between the satellites changes by two to three kilometers during one turn around the Earth,” says Bettadpur. “And we can account for all but a few millimeters from what we already know. What we don’t know are things like the water cycle on land or the changing ice sheets, but we think these cause the little bit of motion we can’t account for.”
In the decade since its launch, GRACE has observed a number of significant changes in the water cycle. GRACE revealed losses in ice mass on Greenland (where the loss is dramatic), Alaska, and Antarctica. The gravity measurements revealed how much the melting glaciers are contributing to sea level rise by recording both ice lost from land and the mass gained in the ocean.
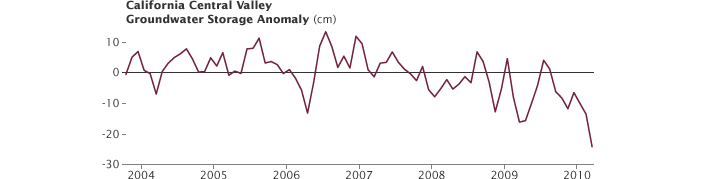
California’s Central Valley is one of the areas where GRACE detected a decline in ground water reserves since 2003. (Graph adapted from Famiglietti et al., 2011.)
Looking at changes in groundwater levels over time, Rodell and Famiglietti have identified a disturbing trend. “GRACE shows where people are using more water than is naturally available or sustainable,” says Rodell. “Scientists predicted this trend based on what we know about water use. But until we had GRACE, we couldn’t quantify it very well for many parts of the world.”
“GRACE gives you variations in the total water stored on and in the land,” confirms Rodell. “But in order to figure out whether those changes are happening in the ground water, soil moisture, snow, or surface water, we need auxiliary information. We use physics equations and computer models to figure out what happens to the water after it hits the land as rain or snow.”
In some parts of the world, particularly the tropics, most of the water is stored on the surface in lakes, rivers, and wetlands. In cold regions, water mostly accumulates as snow and ice. In the temperate middle latitudes (including most of the United States), soils and aquifers are the major stores of water.
In the top layer of the soil, the spaces between the soil grains are filled with air and water, explains Famiglietti. Gravity pulls the water down into the Earth, so as you go progressively deeper in the soil, the pore spaces become more and more full. When water fills every pore, the soil is saturated.
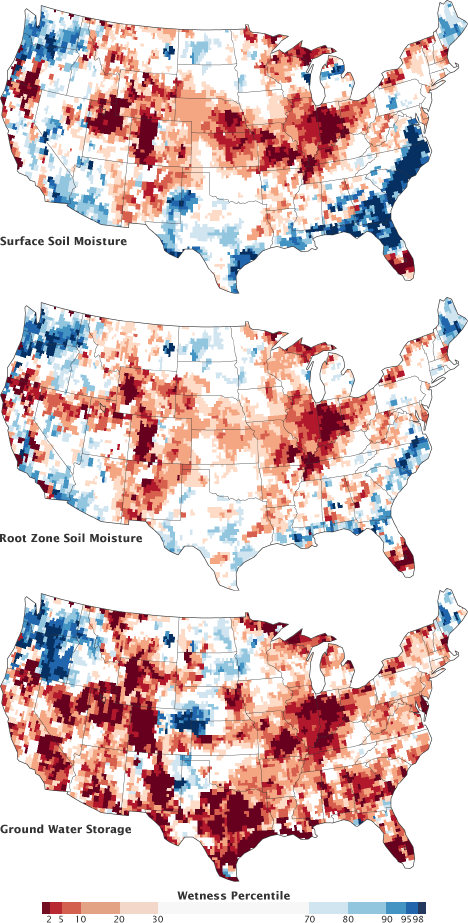
Scientists combine GRACE data with ground-based measurements to map water at the surface, in the root zone, and stored in ground water. These maps compare conditions during the week of August 20, 2012, to the long-term average from 1948 to the present. For example, dark red regions represent dry conditions that should occur only 2 percent of the time (once every 50 years). (Maps by Chris Poulsen, National Drought Mitigation Center at the University of Nebraska-Lincoln, based on data from Matt Rodell, NASA Goddard Space Flight Center, and the GRACE science team.)
This saturation point is the top of the “water table,” where groundwater is stored. The distinction between soil moisture (the unsaturated zone) and groundwater (the saturated zone) is important because groundwater flows easily enough for people to tap with wells and pumps. It is much harder to get water from unsaturated soil.
One way Rodell distinguishes between snow, surface water, soil moisture, and groundwater is a process of elimination. He also assembles data on how much rain or snow has fallen at each location, the soil type, amount of sunlight, wind speed, and other meteorological variables, and combines them within a land surface model. This computer model uses hundreds of equations to determine the fate of energy from the Sun and of water after that energy hits the land surface. The results include maps of groundwater, soil moisture, and evaporation, and how they all vary over time.
While the societal and scientific value of groundwater measurements from space was always clear, scientists were initially hesitant to trust GRACE. “We claimed we could measure water under the ground,” says Byron Tapley. “The ability to penetrate the Earth from space is a paradigm shift for a community of hydrologists who are used to measuring underground water from wells.”
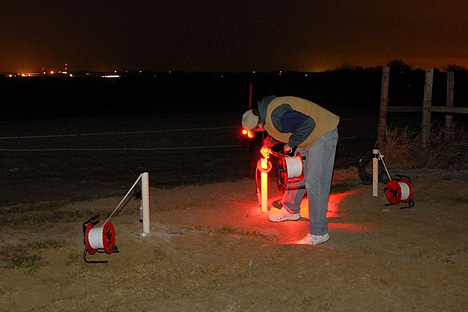
A United States Geological Survey researcher measures groundwater levels in a well near Oakland, Nebraska. (Photograph courtesy USGS Multimedia Gallery.)
To convince them that GRACE was indeed measuring groundwater, the science team set out to find a location without water. “We tried to do a test to show that there was no gravity signal over very dry regions,” says Tapley. The perfect candidate would be the world’s largest desert: the Sahara. The test didn’t work: “It turned out that there’s a fairly large aquifer under the Sahara Desert.”
So instead of looking for a place where there was little ground water, the team turned their attention to where there was a lot. One of the largest aquifers in the United States is buried under the state of Illinois. Nineteen major wells tap the aquifer, providing a network of ground measurements of the water table.
Those measurements—the sort hydrologists are used to—matched GRACE observations. Additional measurements of groundwater in Oklahoma, California, and India provided even more validation.
Over time, evidence and confidence mounted. As Rodell and Famiglietti published result after result, scientists began to recognize the potential of GRACE data. “People eventually realized that if you’re interested in measuring deep soil moisture or ground water from space,” Rodell says, “GRACE is the only game in town.”
Being able to see groundwater change is nice, but to make that measurement useful to decision makers, Wardlow needed to put the measurement into context. Just how bad was the 2011 drought compared to others in the past century? GRACE has only been in orbit since 2002, so how could Wardlow compare 2011 to droughts in the 1970s or 1950s?
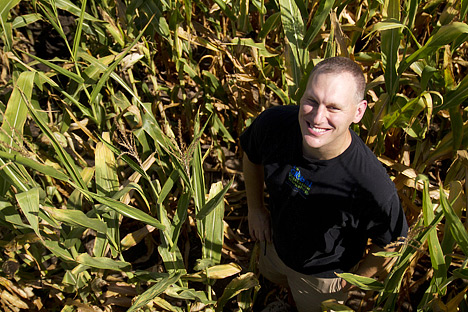
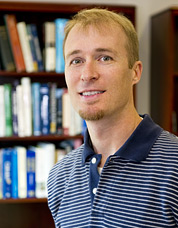
Brian Wardlow combines ground measurements with GRACE data to map soil moisture and ground water throughout the United States. (Photograph courtesy University of Nebraska, Lincoln.)
When challenged to provide that context, Rodell’s solution was a simulation of his land surface model based on historical meteorological data from 1948 to the present. After ensuring that the introduction of GRACE data into the model in 2002 did not cause any sudden shifts in the model’s depiction of reality, Rodell used the six-decade simulation to compare with current conditions.
“For each week, we look at the water storage in the current week versus our long-term record from the model,” says Rodell. The comparison allows Rodell to rank drought conditions and to provide much needed context. For instance, a severe drought might be ranked at two percent, meaning that since 1948, conditions were drier just two percent of the time. After three years of developing and refining his method, Rodell started to deliver GRACE products in 2011 to Wardlow.
This method of presenting GRACE measurements as a percent of normal was just what the drought monitors needed. “It allows us to compare GRACE groundwater with other drought indicators,” says Wardlow. “It helps the drought analysts converge on a category of drought severity.” That decision is important because farmers, insurance companies, and government officials use the assessment to determine the level of response to a drought.
“On a practical level, there is some hesitancy and some skepticism to use the data sets,” admits Wardlow. “The drought monitors like to look at things over a period of a year or two years to see if the patterns make sense. So we’re still in that buy-in period.”
But if GRACE has proven anything, it’s that it can overcome doubt.
