Not a person alive in the U.S. has gone without seeing geosynchronous images of clouds and the Earth from space. These are used in every TV weather forecast throughout the nation and elsewhere in the globe. Highlights are often shown during hurricane season and during severe storms or blizzards that ground aircraft or cripple regions of the country.
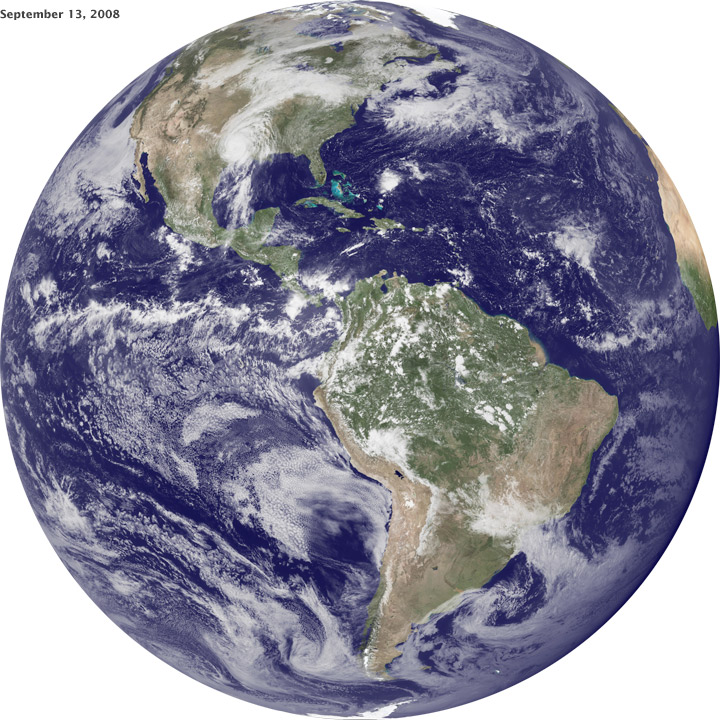
Hurricane Ike made landfall over Galveston Island on September 13, 2008. The GOES-12 satellite monitored the storm from its birth in the mid-Atlantic until its demise over the central United States. (NASA Image courtesy GOES Project Science Office.)
A plethora of satellite imagery document natural (or human-caused) disasters, such as tsunamis, hurricanes and typhoons, fires, severe floods, blizzards, droughts, and wars, around the world. The interconnection between sometimes distance places and individual nations becomes clear through satellite imagery.
Views of calving glaciers, sea ice retreat, and other natural and human-influenced changes have also started to seep into the public’s consciousness.
Though not initially discovered from space, seasonal and annual fluctuations of ozone concentration, especially in the important Antarctic ozone hole, have been monitored and studied extensively with the aid of space-based observations.
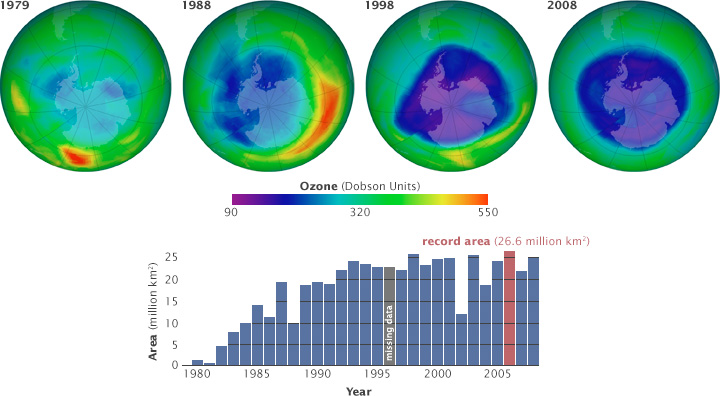
The Total Ozone Mapping Spectrometer revealed the size and depth of the ozone hole that first formed over Antarctica in the 1980s. Scientists used the data to demonstrate the need for a ban on ozone-destroying chemicals, which went into effect in 1989. (Images and data courtesy NASA Ozone Hole Watch.)
The view from space has enabled the observation of:
I like the view of ship tracks in the eastern Atlantic off the Iberian Peninsula. The phenomenon of ship tracks is a clear signature of how burning fossil fuels modifies clouds. A cloud modified by the small particles released when fossil fuels are burned is brighter when viewed from the vantage point of space.
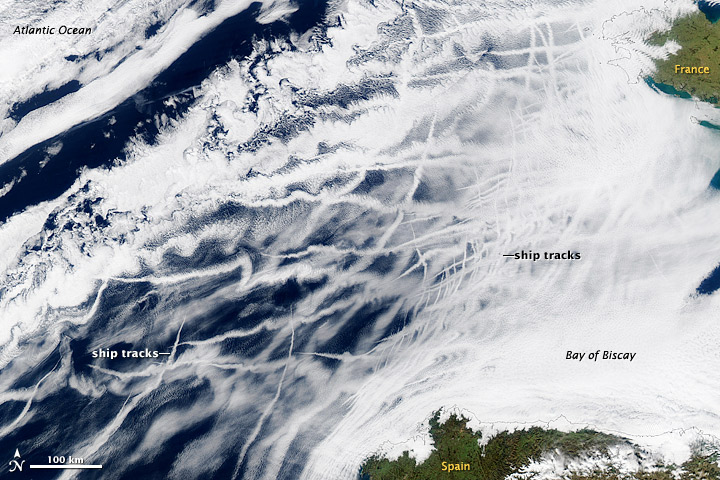
Ship tracks off the Atlantic coast of Europe. (NASA image by Jacques Descloitres, MODIS Rapid Response Team.)
My favorite picture, the one I start my public talks with, is the Earth taken from the Moon by the Apollo astronauts. The Earth looks so alone and fragile.
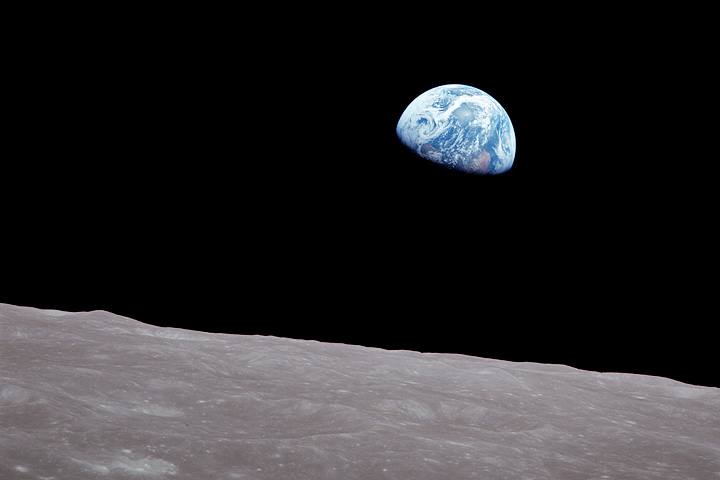
Earth from the Apollo 8 Command Module on December 26, 1968. (NASA astronaut photograph AS08-14-2383.)
Until satellites, most terrestrial ecologists could only study their own backyard. Twenty years ago, more than 90 percent of the papers in the journal Ecology were on studies from 0.1 hectare plots. Satellites gave us a continental and global look at the biosphere where we could compare and contrast ecosystems all over the world and monitor change. Change detection of virtually all the key global habitability indicators would have been impossible without the repeatability and consistency of the satellite record. I can sit at my computer and effectively study any ecosystem on Earth anywhere. That’s pretty cool.
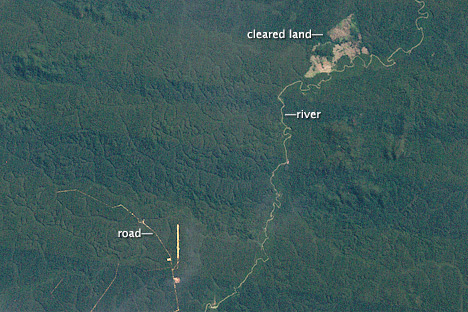
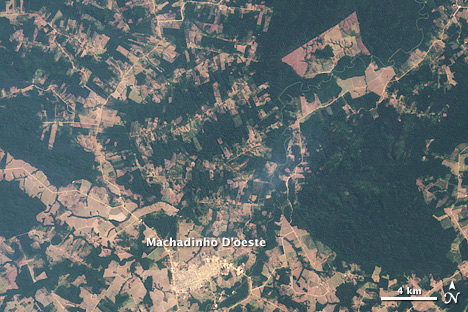
Satellites make it possible to regularly collect data over even the most remote places. These two Landsat images, acquired in 1984 and 2005, show the growth of Machadinho D’oeste in the Brazilian state of Rondonia.The town is at bottom center, surrounded by cleared rainforest. (NASA images by Robert Simmon, based on Landsat data from the University of Maryland Global Land Cover Facility.)
