As a geologist, my perspective of the Earth as a planet in space did not change with the opportunity to view it on the way to the Moon. But I was impressed by how well I could observe and forecast weather patterns during those three days, with the help of a 10X monocular. The Apollo views of the full Earth disk have stimulated thought on the value of continuous monitoring the full disk from the Moon as inherently different than the views from Earth orbit.
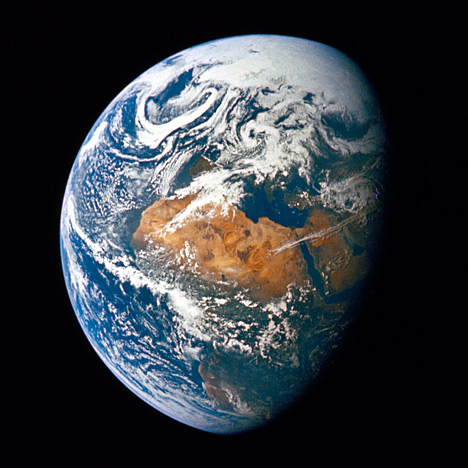
Apollo astronauts captured a series of over 700 photographs of the Earth’s disk on their way to and from the moon. A crew member of Apollo 10 snapped this shot while he was 100,000 nautical miles (185,000 kilometers) from Earth on May 18, 1969. (Astronaut Photograph AS10-34-5026.)
First of all, seeing Earth from space has a psychological impact on human’s awareness of the planet we are all sharing. It heightens our sense of the global impact of both natural processes and human activities.
Scientifically, observing Earth from space has revolutionized our understanding of Earth as a system. For the first time we are able to see how the world’s landscape has been changing on a scale not amenable to ground-based observations. We begin appreciating the ocean’s effects on weather on land through dramatic events like El Niño. We are seeing the minute change of global sea level as well as the rapidly disappearing Arctic sea ice as a consequence of global warming. By comparing measurements of topography taken at different times, we can delineate the slow change of the surface of Earth that results from the tectonic movement of Earth’s crust. We are even able to detect the minute change of Earth’s gravity field caused by the melting of ice on Greenland and Antarctica as well as by the seasonal change of ground water on land.
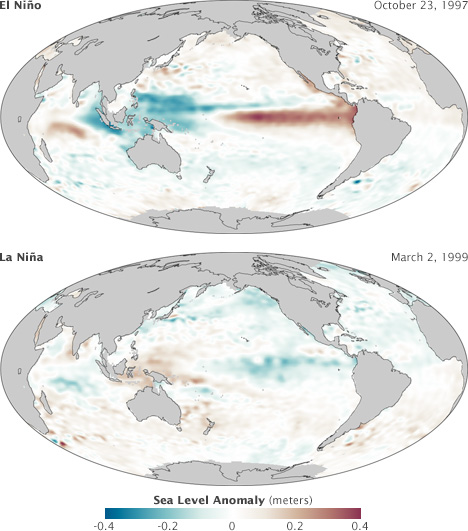
El Niño and La Niña are characterized by large-scale changes in equatorial Pacific Ocean currents. The TOPEX/Poseidon satellite monitored changes in sea-surface height during the record 1997 El Niño and subsequent 1999 La Niña. In October 1997, warm water piled up off the west coast of South America, raising sea level (red), while in March 1999, the cool waters of La Niña dropped the sea level below normal (blue). (Maps by Robert Simmon, based on TOPEX/Poseidon data from the World Ocean Circulation Experiment.)
Viewing Earth from space enabled the following scientific discoveries, not in ranked order and surely biased by my own perspective:
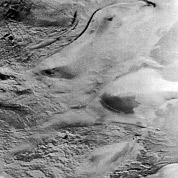
My favorite image is a rather poor quality image by today’s standards. It made the cover of Eos (an Earth science journal) because it was the “Ah-Hah!” image that gave us the very first view of fast moving ice streams in the midst of the Antarctic ice sheet. We could identify them because their surfaces were rougher (bumpier) than the much slower flowing ice on either side. Prior to this image we only knew they were there, but we had no effective means to map their extent. Seeing this image come up on the screen and knowing I was looking at something significant that no one had ever seen before remains one of the most memorable days of my scientific career.
From my particular field of ice sheet dynamics, satellite observations have given us the ability to see how fast ice sheets move, how the ice funnels into outlet glaciers, and (from the ability to see subtle flow features) tell how the ice flowed in the millennial past.
Satellite data have revolutionized glaciology. It’s as simple as that. We know more about what is going on at the remote high latitudes and high altitudes from the satellite observations of the past 50 years than we would have every known from hundreds of years of ground observations.
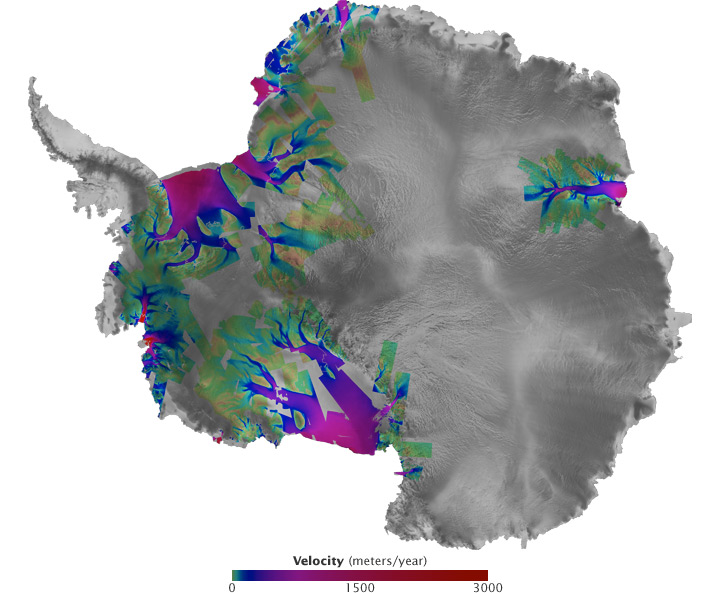
Colors indicate the speed of flowing ice in Antarctica’s outlet glaciers. The glaciers move relative slowly (one or two meters per year) in the interior and speed up tremendously as they approach the sea. This image includes data from several orbiting radar instruments. (NASA image courtesy Eric Rignot, Jet Propulsion Laboratory.)
