Due to gaps and limitations in historical records of storms, some scientists have turned to general circulation models (GCMs) for answers. GCMs are computer models that divide the globe up into three-dimensional grids, with the side of each box typically representing about 150 to 200 kilometers (90 to 125 miles) of the Earth. The conditions within each box are defined by equations that depict features of the oceans and atmosphere, such as temperature, humidity, pressure, and wind. The models also include factors that can affect those features, such as the concentration of greenhouse gases, the reflectivity of Earth’s surface, or the distribution of clouds or aerosols.
Models are useful because they make it possible to parse out how each different factor might influence climate in a given location. By adding, removing, and adjusting the variables, scientists can develop a deeper understanding of how the many pieces of the climate puzzle fit together.
“Models allow us to test hypotheses and improve our understanding in ways that no other type of experiment can,” says Del Genio. “They are criticized for predicting things ‘wrong’ and for the lack of agreement between them. But a model simulation that predicts something incorrectly can be just as useful for revealing underlying processes as a model run that gets the ‘right’ answer.”
Climate models are quite good at working out features of the atmosphere on a broad scale, and they do a reasonably good job of simulating large extra-tropical cyclones, which can stretch hundreds of kilometers. But they struggle to simulate hurricanes or thunderstorms, and they cannot produce key details (such as the heaviest bands of wind and rain) in extra-tropical storms. Hurricanes are generally about 150 kilometers (90 miles) across; an individual thunderstorm is usually less than 10 kilometers (6 miles). Both are smaller than the typical grid boxes in a climate model.

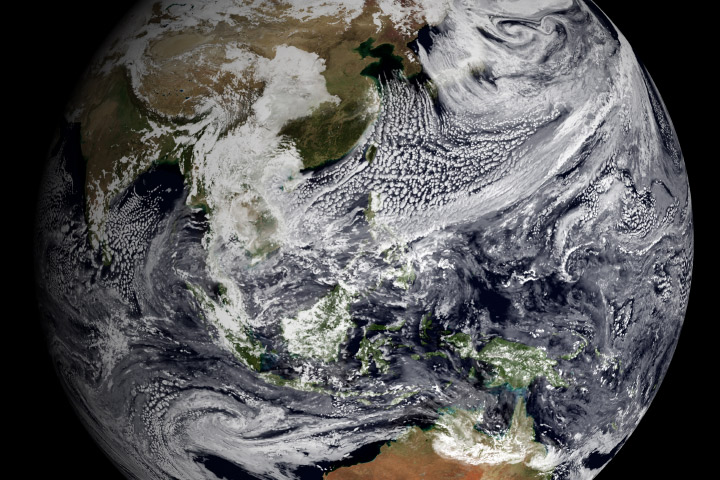
Thunderstorms are smaller than the resolution of a typical global climate model. However, a new generation of regional models that include high-resolution, real-world data now provide scientists with a detailed look at thunderstorms and other small-scale features of the atmosphere. (Astronaut photograph ISS022-E-006510.)
To address this problem, climate modelers have started to develop a new generation of models that reduce the size of the boxes in key regions by “downscaling.” One way they do this is by adding very detailed information about something that’s well known, like topography, into a low-resolution climate model. They also add ever-more detailed information from real-world satellites.
“Downscaling to simulate storms is a bit like knowing that you have a low-resolution image of a face that’s so blurry you can hardly tell what it is,” explained Gavin Schmidt, a climate modeler at NASA’s Goddard Institute for Space Studies. “You take clues from a low-resolution image and then map them with other information about things like eye color, skin colors, and nose shapes to construct a more reasonable image of what the face really looks like.”
Trapp’s research group at Purdue, for example, used downscaling to incorporate data from a coarse climate model into a finer-resolution weather forecasting model. This made it possible to resolve some individual thunderstorms in the central United States and even some of the smaller elements of storms. Overall, the model captured daily rainfall patterns with surprising accuracy over a ten-year period.
“No model can predict the future perfectly,” says Del Genio. “But there’s no question that models are helping us with the underlying science.”
In some cases, the work has just begun. While climatologists have extensively studied tropical storms, they’ve hardly studied some of the more exotic types of storms. Sandy, for example, began in the Caribbean as a typical tropical storm but then morphed into a “hybrid” with extra-tropical characteristics. While tropical cyclones draw their energy from warm ocean waters, extra-tropical cyclones are fueled by sharp temperature differences between fronts in the atmosphere. Sandy was able to tap energy from both sources, which is part of the reason it was so destructive.

“No model can predict the future perfectly,” says Del Genio. “But there’s no question that models are helping us with the underlying science.” (Photograph courtesy Anthony Del Genio, NASA Goddard Institute for Space Studies.)
Shepherd does think warming had an influence on Sandy, but he advises against rushing to judgment. “We do not know whether superstorms like Sandy are harbingers of a ‘new normal’, he says. “It’s a bit like steroids usage and home run statistics for baseball. Some influence was surely there, but we have more work to do before we can say precisely what percentage of home runs were helped by steroids.”
And then, of course, the inherent variability of the oceans and atmosphere means storm trends don’t follow straightforward patterns. After the record-shattering tornado outbreaks of 2011, for instance, the year 2012 was unusually quiet.
“There was a strong impulse to over-interpret and attribute tornadoes to climate change in 2011,” says Del Genio. “2012 was a good reminder that we can’t do that. We have to be patient if we really want to understand the relationship between storms and climate. The attribution is about trends and understanding underlying processes. It is not about flagging individual events with some sort of scarlet letter.”
