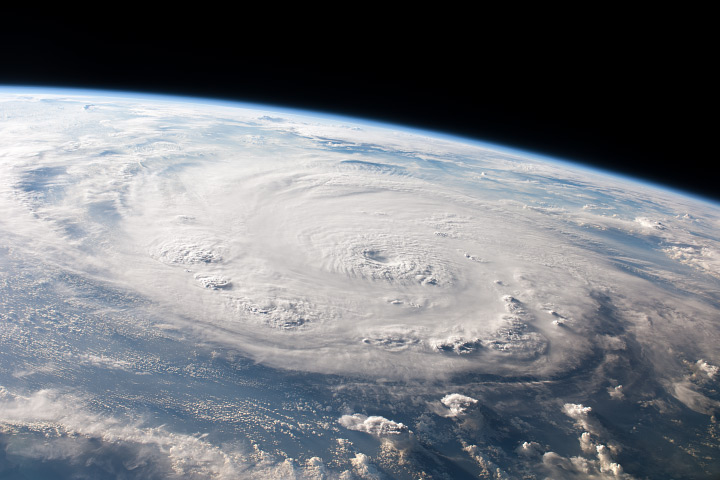
Few images are as beautiful and as terrifying as a satellite view of a hurricane about to make landfall. On October 29, 2012, the Suomi NPP satellite captured an ominous nighttime view of Sandy—an enormous hybrid storm that was part hurricane, part Nor‘easter—churning off the coast of New Jersey.
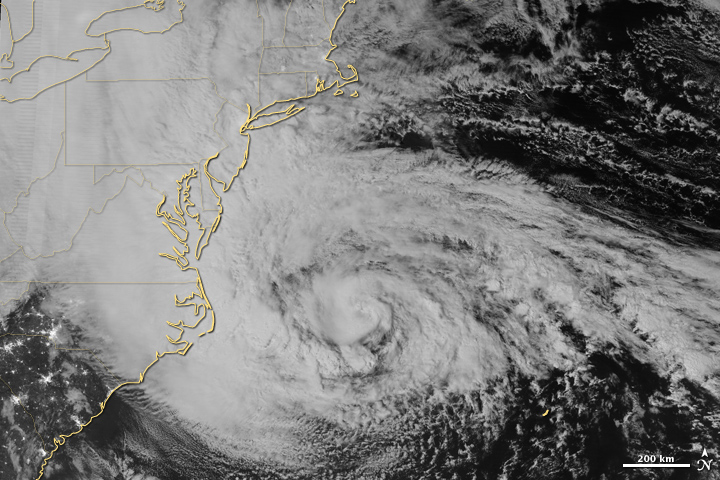
Hurricane Sandy approaches the Atlantic coast of the U.S. in the early morning hours of October 29, 2012. (NASA Earth Observatory image by Jesse Allen and Robert Simmon, using VIIRS Day-Night Band data from the Suomi National Polar-orbiting Partnership.)
The string of city lights that stretches from Washington to Boston was mostly gone, blanketed by thick, ghostly storm clouds. One of the most brightly lit cities in the world, New York, was little more than a faint smudge through Sandy’s clouds.
In a matter of hours, that smudge of light would go dark. Large swaths of Manhattan were under water. The Rockaways were on fire. Rooftops along the New Jersey shore became temporary islands for people escaping a wall of seawater that surged inland.

Hurricane Sandy knocked out power to much of lower Manhattan, New York. (Photograph ©2012 Several seconds.)
Was Superstorm Sandy an expression of a “new normal” for our weather? Was it a storm pumped up by global warming?
“If you look at the unique set of circumstances in which Sandy emerged and you know something about meteorology and climate,” says Marshall Shepherd, director of the atmospheric sciences program at the University of Georgia, “it’s hard not to ask yourself these kinds of questions.”
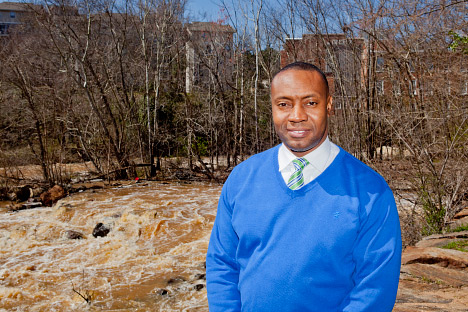
Research meteorologist Marshall Shepherd compares climate change and weather extremes to steroids and baseball. “Some influence was surely there, but we have more work to do before we can say precisely what percentage.” (Photograph courtesy Marshall Shepherd, University of Georgia Atmospheric Sciences Program.)
Sandy is not the only recent storm to make people ask questions about climate change and weather. In 2010, an epic winter storm dubbed “Snowmageddon” dumped more than half a meter (2 feet) of snow across many parts of the U.S. East Coast. And in April 2011, tornadoes killed more than 364 Americans—the most ever in a month. The rash of twisters etched scars of destruction on the landscape so long and wide that they could be seen from space. The United States set records in 2011 and 2012 for the number of weather disasters that exceeded $1 billion in losses; most were storms.
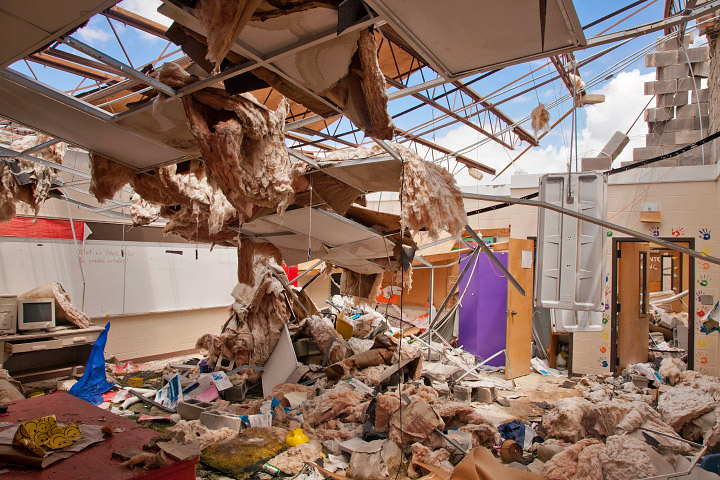
Hackleburg High School in Alabama was destroyed by a tornado in April 2011. (Photograph courtesy Federal Emergency Management Agency.)
All of these weather events have happened as the concentration of greenhouse gases in the atmosphere has been rising higher than it has been for at least 100,000 years. Scientists are nearly certain that the buildup of carbon dioxide has already sparked changes in Earth’s atmosphere and ecosystems. The lowest layer of the atmosphere (the troposphere) has warmed markedly, especially at high latitudes. So have the world’s oceans. Heat waves and droughts have grown more likely and more extreme. Arctic ice is melting at a record pace, and the snowy landscapes of the far north have started melting earlier each year.
Given all the change that has already take place, it’s reasonable to wonder if climate change has affected storms as well. “After the tornadoes in 2011, I was flooded with calls from reporters,” says Anthony Del Genio, a climatologist at NASA’s Goddard Institute for Space Studies (GISS). “People wanted quick, definitive answers. The trouble is that’s not where the science is.”
Historically, research on tornadoes, hurricanes, and other types of storms has focused on short-term forecasting, not on understanding how storms are changing over time. Reliable, long-term records of storms are scarce, and the different reporting and observing methods have left many scientists and meteorologists feeling skeptical. But the study of storminess and climate has begun to mature, says Del Genio, and a consensus is emerging: for several types of storms, global warming may prime the atmosphere to produce fewer but stronger storms.
What exactly does it mean for storms to get “stronger”? Does it mean faster winds? A larger wind field? Lower pressure at the center? More rain and snowfall? Higher storm surges?
“You have to remember that storms aren’t one-dimensional,” says Del Genio. “There are many types of storms, and sorting out how aspects of each type respond to warming is where the science really gets interesting.”
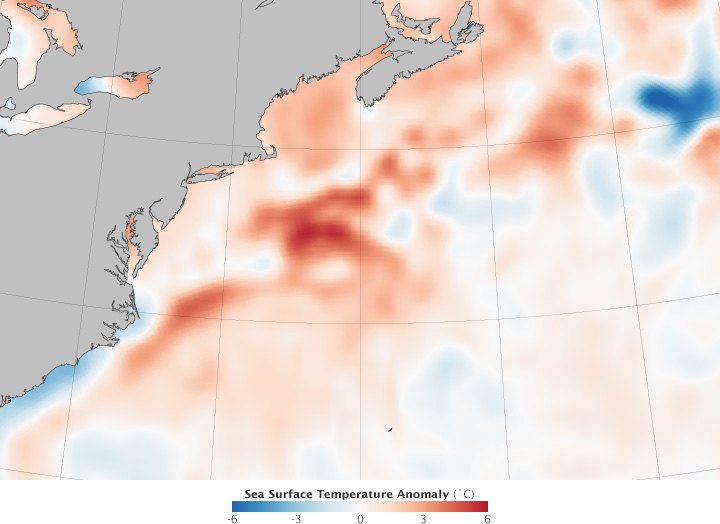
Rising sea levels exacerbated Sandy’s storm surge, for example, a direct link between global warming and storm damage. And abnormally high sea surface temperatures in the Atlantic probably intensified the storm. But pinning all of Sandy’s fury—its hybrid nature, the scale of its winds, its unusual track—on global warming is premature, says Shepherd, the current president of the American Meteorological Society.
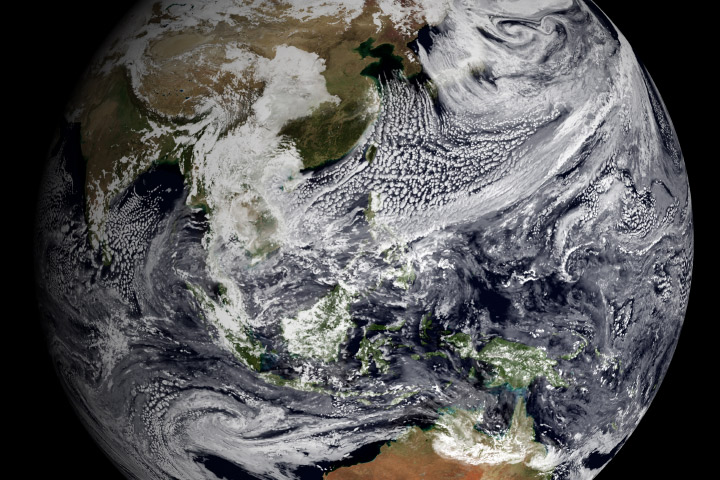
Weather forecasters use terms like snowstorms, derechos, hailstorms, rainstorms, blizzards, low-pressure systems, lightning storms, hurricanes, typhoons, nor‘easters, and twisters. Research meteorologists and climatologists have a simpler way of dividing up the world’s storms: thunderstorms, tropical cyclones, and extra-tropical cyclones. All are atmospheric disturbances that redistribute heat and produce some combination of clouds, precipitation, and wind.
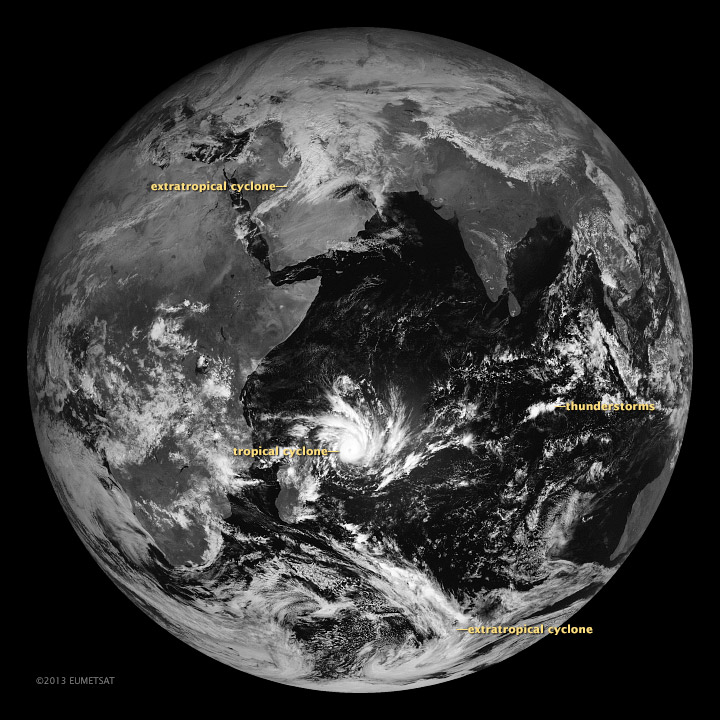
Tropical cyclones, extra-tropical cyclones, and thunderstorms are the three fundamental types of storms studied by the climate change community. (Image ©2013 EUMETSAT.)
Thunderstorms are the smallest type, and they are often part of the larger storm systems (tropical and extra-tropical cyclones). All storms require moisture, energy, and certain wind conditions to develop, but the combination of ingredients varies depending on the type of storm and local meteorological conditions.
For example, thunderstorms form when a trigger—a cold front, converging near-surface winds, or rugged topography—destabilizes a mass of warm, humid air and causes it to rise. The air expands and cools as it ascends, increasing the humidity until the water vapor condenses into liquid droplets or ice crystals in precipitation-making clouds. The process of converting water vapor into liquid water or ice releases latent heat into the atmosphere. (If this doesn’t make sense, remember that the reverse—turning liquid water into water vapor by boiling it—requires heat).
Storms feed off of latent heat, which is why scientists think global warming is strengthening storms. Extra heat in the atmosphere or ocean nourishes storms; the more heat energy that goes in, the more vigorously a weather system can churn.
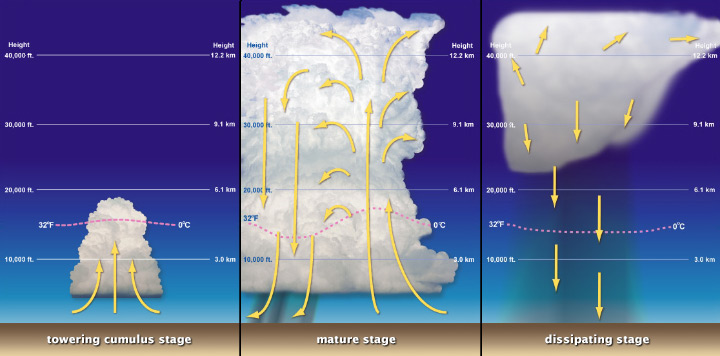
Thunderstorms derive their energy from the heat released by the condensation of water vapor. This “latent heat” energy drives thunderstorm clouds high into the atmosphere. Thunderstorms dissipate when the cold downdraft created by falling rain drops stifles rising warm air. (Image adapted from NOAA National Weather Service Life Cycle of a Thunderstorm.)
Already, there is evidence that the winds of some storms may be changing. A study based on more than two decades of satellite altimeter data (measuring sea surface height) showed that hurricanes intensify significantly faster now than they did 25 years ago. Specifically, researchers found that storms attain Category 3 wind speeds nearly nine hours faster than they did in the 1980s. Another satellite-based study found that global wind speeds had increased by an average of 5 percent over the past two decades.
There is also evidence that extra water vapor in the atmosphere is making storms wetter. During the past 25 years, satellites have measured a 4 percent rise in water vapor in the air column. In ground-based records, about 76 percent of weather stations in the United States have seen increases in extreme precipitation since 1948. One analysis found that extreme downpours are happening 30 percent more often. Another study found that the largest storms now produce 10 percent more precipitation.
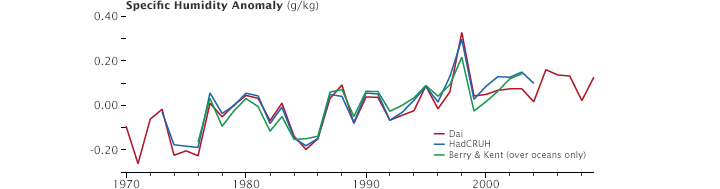
Increases in global temperature have raised atmospheric humidity. (Graph by Robert Simmon, based on data from the NOAA National Climatic Data Center.)
William Lau, a scientist at NASA’s Goddard Space Flight Center, concluded in a 2012 paper that rainfall totals from tropical cyclones in the North Atlantic have risen at a rate of 24 percent per decade since 1988. The increase in precipitation doesn’t just apply to rain. NOAA scientists have examined 120 years of data and found that there were twice as many extreme regional snowstorms between 1961 and 2010 as there were from 1900 to 1960.
But measuring a storm’s maximum size, heaviest rains, or top winds does not capture the full scope of its power. Kerry Emanuel, a hurricane expert at the Massachusetts Institute of Technology, developed a method to measure the total energy expended by tropical cyclones over their lifetimes. In 2005, he showed that Atlantic hurricanes are about 60 percent more powerful than they were in the 1970s. Storms lasted longer and their top wind speeds had increased by 25 percent. (Subsequent research has shown that the intensification may be related to differences between the temperature of the Atlantic and Pacific oceans.)
If understanding the impact of global warming on storms were simply a matter of tallying up extra moisture, the answer would be pretty straightforward. However, reality is more complicated. Putting extra water vapor into the atmosphere is just one of the ways global warming is changing the planet. Another important factor is how the heat in the atmosphere is distributed.
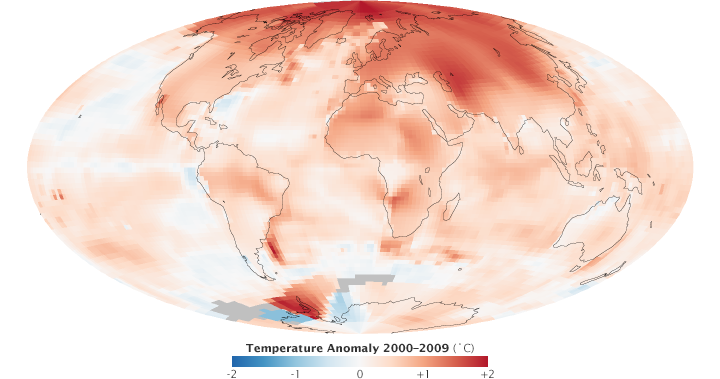
Since the mid Twentieth Century, average global temperatures have warmed about 0.6°C (1.1°F), but the warming has not occurred equally everywhere. Temperatures have increased about twice as fast in the Arctic as in the mid-latitudes. The loss of sea ice is a key reason why. Bright and reflective ice is giving way to darker, open ocean—amplifying the warming trend by absorbing more heat from the Sun. On the other hand, the abundance of convection and thunderstorms in the tropics contributes to a slower rate of warming by transporting heat away from the surface.
Climatologists think the differing rates of warming from the equator to the poles could have a significant impact on some types of storms. Extra-tropical cyclones, for example, harvest energy from the atmosphere when masses of warm and cold air interact along the polar front—the boundary between cooler polar air and warmer subtropical air. As the difference between the temperature at the poles and the tropics decreases, there could be less energy for these storms to absorb, a change that could weaken them or make them less frequent.
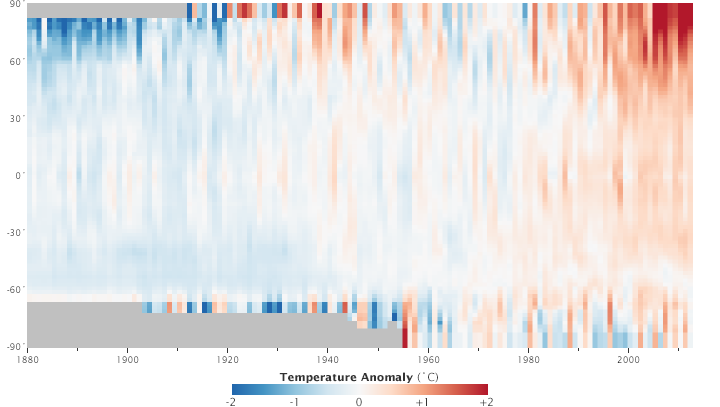
Temperatures are warming more near the poles than near the equator. This plot shows the change in temperature versus latitude from 1880 to 2012. The reduced temperature contrast between high latitudes and the tropics likely weakens extra tropical cyclones. (NASA image by Robert Simmon, with GISS Surface Temperature Analysis (GISTEMP) data.)
“Sorting out opposing factors is what makes this such a challenging problem,” Del Genio says. “And keep in mind that this is a simplification. These aren’t the only two factors involved.”
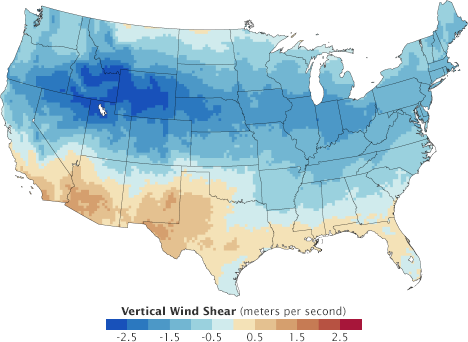
Wind shear—a measure of how the speed and direction of winds differ at different levels of the atmosphere—complicates the picture because it can affect storms in a variety of ways. Tropical cyclones require weak wind shear; in other words, they need minimal differences in wind speeds at adjacent levels of the atmosphere. Strong wind shear tears tropical cyclones apart, preventing heat and moisture from organizing into a storm core.
Research suggests that Atlantic wind shear could increase by 1 to 2 miles (1.6 to 3.2 kilometers) per hour for each degree that global temperatures increase. It’s this potential increase that explains why many climate simulators conclude that the number of tropical cyclones will stay the same or decrease even as the strongest storms get stronger. An article published in 2010 by a group of the world’s leading storm experts concluded that the average intensity of tropical cyclones will likely increase by 2 to 11 percent by 2100, but the overall frequency of storms will decrease between 6 and 34 percent.
Hurricane Felix hovers over the Caribbean Sea, as viewed from the International Space Station on September 3, 2007. (Astronaut photograph ISS015-E-25054.)
Another complicating factor is that the same changes in equator-to-pole temperatures that could influence storm formation could also affect the winds that steer them. For instance, jet streams—meandering streams of fast-moving air that play a key role in steering storms—could speed up or slow down. A sluggish jet stream would mean slower-moving storms that could dump heavier loads of rain and snow, especially in coastal areas.
Preliminary research by Jennifer Francis of Rutgers University suggests that the jet stream’s west-to-east winds have slowed and grown wavier since 1979 because of the loss of Arctic sea ice. Francis has argued that the changes may have contributed to extreme weather events in recent years by creating large dips or kinks in the jet stream—what meteorologists call “blocking” patterns.
Blocking patterns are areas of persistently high pressure that often accompany extreme weather. It was a blocking high, for example, that led to long-lived downpours and devastating flooding in Pakistan in 2010. And it was a similar persistent blocking pattern that caused record melting in Greenland in the summer of 2012 and helped push Superstorm Sandy inland rather than out to sea.
Although more rain and snow are falling from storms, it’s more difficult to say how global warming will affect the formation of those storms in the first place. “This would be a much easier nut to crack if the effects of warming all pointed to more frequent, stronger storms,” says Harold Brooks, a meteorologist at NOAA’s National Severe Storms Laboratory. “Unfortunately, they don’t.”
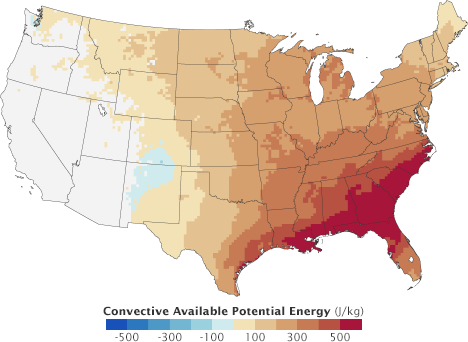
Though thunderstorms are familiar and seemingly non-threatening, severe thunderstorms—with sustained winds above 93 kilometers (58 miles) per hour or with unusually large hail—can lead to supercells, derechos, and tornadoes. Several key ingredients are required for severe thunderstorms, starting with the presence of warm, moist air near the surface and a store of potential energy once that air begins to rise. Meteorologists call this combination “convective available potential energy,” or CAPE. The higher the CAPE, the more potential an air mass has to create the towering cumulus clouds that create storms.
“CAPE can provide storms with the raw fuel to produce rain and hail,” says Brooks, “and vertical wind shear can pull and twist weak storms into strong, windy ones.”
Climate change should, theoretically, increase potential storm energy by warming the surface and putting more moisture in the air through evaporation, Brooks explained. But on the other hand, disproportionate warming in the Arctic should lead to less wind shear in the mid-latitude areas prone to severe thunderstorms, making the storms less likely.
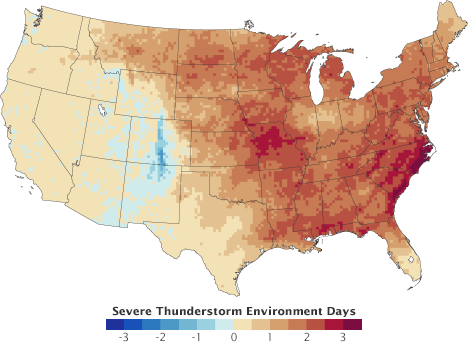
In recent years, Del Genio conducted simulations to assess global warming’s impact on thunderstorms in the United States. Working with a climate model maintained by the Goddard Institute for Space Studies, he found that the number of severe storms would not change much, but the strongest storms would have even stronger and more destructive winds.
Another study, led by Robert Trapp of Purdue University, found that a doubling of greenhouse gases in the atmosphere would significantly increase the number of days that severe thunderstorms could occur in the southern and eastern United States. Cities such as Atlanta and New York could see a doubling of the number of days that severe thunderstorms could occur, the models suggested. “The increase in CAPE more than compensated for the decrease in wind shear,” Trapp says.
However, both scientists caution that there’s uncertainty in their findings because of the meager scientific attention thunderstorms have received. Unlike tropical cyclones, which climate researchers have studied intensely since Hurricane Katrina struck New Orleans in 2005, only a handful of researchers have focused on the impact of global warming on severe thunderstorms.
Then there are problems unique to tornadoes. Beyond knowing that they require a certain type of wind shear, meteorologists just don’t know much about why some thunderstorms generate tornadoes and others don’t. (Only about 1 percent of thunderstorms generate tornadoes.) “You can’t just take the results of the modeling for severe thunderstorms and assume they apply to tornadoes,” says Del Genio.
Similar problems confound research about extra-tropical and tropical cyclones. Conventional wisdom holds that extra-tropical cyclones will be somewhat less likely in a warmer world because the differences in temperatures between the tropics and the Arctic—one of the key elements fueling extra-tropical storms—should decline.
But again, there are competing forces. At higher altitudes in the upper troposphere—above 5 kilometers (3 miles) —the air is warming more quickly at the equator than at the poles. Since upper troposphere temperatures and winds are key to the formation of extra-tropical cyclones, changes at that level could counteract changes lower in the atmosphere.
Due to gaps and limitations in historical records of storms, some scientists have turned to general circulation models (GCMs) for answers. GCMs are computer models that divide the globe up into three-dimensional grids, with the side of each box typically representing about 150 to 200 kilometers (90 to 125 miles) of the Earth. The conditions within each box are defined by equations that depict features of the oceans and atmosphere, such as temperature, humidity, pressure, and wind. The models also include factors that can affect those features, such as the concentration of greenhouse gases, the reflectivity of Earth’s surface, or the distribution of clouds or aerosols.
Models are useful because they make it possible to parse out how each different factor might influence climate in a given location. By adding, removing, and adjusting the variables, scientists can develop a deeper understanding of how the many pieces of the climate puzzle fit together.
“Models allow us to test hypotheses and improve our understanding in ways that no other type of experiment can,” says Del Genio. “They are criticized for predicting things ‘wrong’ and for the lack of agreement between them. But a model simulation that predicts something incorrectly can be just as useful for revealing underlying processes as a model run that gets the ‘right’ answer.”
Climate models are quite good at working out features of the atmosphere on a broad scale, and they do a reasonably good job of simulating large extra-tropical cyclones, which can stretch hundreds of kilometers. But they struggle to simulate hurricanes or thunderstorms, and they cannot produce key details (such as the heaviest bands of wind and rain) in extra-tropical storms. Hurricanes are generally about 150 kilometers (90 miles) across; an individual thunderstorm is usually less than 10 kilometers (6 miles). Both are smaller than the typical grid boxes in a climate model.
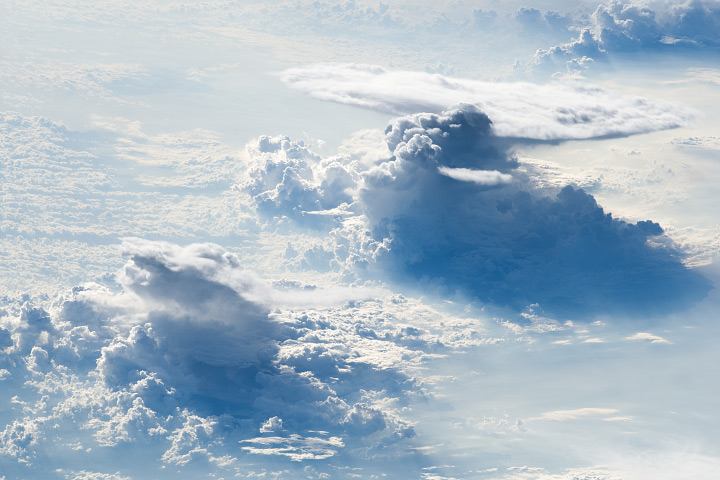
Thunderstorms are smaller than the resolution of a typical global climate model. However, a new generation of regional models that include high-resolution, real-world data now provide scientists with a detailed look at thunderstorms and other small-scale features of the atmosphere. (Astronaut photograph ISS022-E-006510.)
To address this problem, climate modelers have started to develop a new generation of models that reduce the size of the boxes in key regions by “downscaling.” One way they do this is by adding very detailed information about something that’s well known, like topography, into a low-resolution climate model. They also add ever-more detailed information from real-world satellites.
“Downscaling to simulate storms is a bit like knowing that you have a low-resolution image of a face that’s so blurry you can hardly tell what it is,” explained Gavin Schmidt, a climate modeler at NASA’s Goddard Institute for Space Studies. “You take clues from a low-resolution image and then map them with other information about things like eye color, skin colors, and nose shapes to construct a more reasonable image of what the face really looks like.”
Trapp’s research group at Purdue, for example, used downscaling to incorporate data from a coarse climate model into a finer-resolution weather forecasting model. This made it possible to resolve some individual thunderstorms in the central United States and even some of the smaller elements of storms. Overall, the model captured daily rainfall patterns with surprising accuracy over a ten-year period.
“No model can predict the future perfectly,” says Del Genio. “But there’s no question that models are helping us with the underlying science.”
In some cases, the work has just begun. While climatologists have extensively studied tropical storms, they’ve hardly studied some of the more exotic types of storms. Sandy, for example, began in the Caribbean as a typical tropical storm but then morphed into a “hybrid” with extra-tropical characteristics. While tropical cyclones draw their energy from warm ocean waters, extra-tropical cyclones are fueled by sharp temperature differences between fronts in the atmosphere. Sandy was able to tap energy from both sources, which is part of the reason it was so destructive.

“No model can predict the future perfectly,” says Del Genio. “But there’s no question that models are helping us with the underlying science.” (Photograph courtesy Anthony Del Genio, NASA Goddard Institute for Space Studies.)
Shepherd does think warming had an influence on Sandy, but he advises against rushing to judgment. “We do not know whether superstorms like Sandy are harbingers of a ‘new normal’, he says. “It’s a bit like steroids usage and home run statistics for baseball. Some influence was surely there, but we have more work to do before we can say precisely what percentage of home runs were helped by steroids.”
And then, of course, the inherent variability of the oceans and atmosphere means storm trends don’t follow straightforward patterns. After the record-shattering tornado outbreaks of 2011, for instance, the year 2012 was unusually quiet.
“There was a strong impulse to over-interpret and attribute tornadoes to climate change in 2011,” says Del Genio. “2012 was a good reminder that we can’t do that. We have to be patient if we really want to understand the relationship between storms and climate. The attribution is about trends and understanding underlying processes. It is not about flagging individual events with some sort of scarlet letter.”
