Abandoning His Doubts |
|||
In late 2002, Huete got just the sign he needed to put his doubts behind him. At a meeting of the American Geophysical Union, he saw a poster by ecologist Scott Saleska, then part of a research group led by Steven Wofsy of Harvard University, showing results of field studies at a location in the Tapajos National Forest in Brazil. The site was home to a research tower holding scientific instruments that Saleska and his colleagues had designed and operated as part of NASA’s contribution to a Brazilian-led international research project called “LBA,” short for the “Large-Scale Biosphere-Atmosphere Experiment in Amazonia.” Among the most important measurements collected on the 60-meter tower was the uptake and release of carbon dioxide by the forest. Vegetation takes in carbon during photosynthesis, but also releases it during respiration. Decomposition of dead trees and vegetation also releases carbon dioxide back into the atmosphere. Over the course of the project, they collected observations of the flux of carbon dioxide from the forest and compared those observations with the growth and death of trees surrounding the tower. The observations would reveal whether, overall, the area was a sink or a source of carbon. After they had about two years of data, Saleska realized they were seeing something surprising. Although ecosystem models suggested that plants should be taking up less carbon dioxide in the dry season, when trees were expected to be water-stressed, what they saw was the opposite. Photosynthesis was greater during the dry season than during the wet season. “When I first plotted the comparison between our data and the models,” said Saleska, “I thought for a minute that I had made a mistake by plotting the model predictions upside down.” |
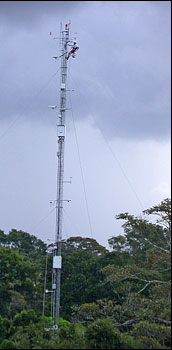
At the Tapajós National Forest in Brazil, scientific instruments on a tall tower measure the rate at which the forest and the atmosphere around the tower exchange gases, such as carbon dioxide. In the image ecologist Scott Saleska scales the tower to check the equipment. (Photograph courtesy Alfredo Huete.) | ||
 |
But results from a second flux tower nearby, operated by Saleska’s colleagues, Michael Goulden from the University of California-Irvine, and Humberto da Rocha, from Brazil’s University of Sao Paulo, showed exactly the same “backwards” pattern, boosting Saleska’s confidence that the measured pattern at both towers was right. Saleska and his colleagues combined the results from the towers and presented them on a poster for the meeting. “For several years, we had been seeing this dry-season green up [in the satellite data] and wondering whether it was real or not,” says Huete. “But when I saw Scott’s results, that the ground data at the tower sites showed the same thing as the satellite data, it really changed everything for me. From that moment, I realized we could stop focusing on ‘what’s wrong’ and instead focus on how to demonstrate that what we were seeing was real.” Getting further encouragementAs he began pulling the satellite data together and deciding the best way to demonstrate to other scientists that the dry-season green-up wasn’t a mistake, Huete got some further encouragement that he was on the right track. In 2003, ecologist Rama Nemani of NASA Ames Research Center (a long-time colleague of Huete’s) and other researchers published research that linked global changes in vegetation productivity between 1982 and 1999 to the three environmental conditions that most affect plant growth: precipitation, sunlight, and temperature. Using 20 years of climate data combined with satellite-based vegetation maps, the team developed a model that predicted which of the three factors most influenced the vegetation in different places on Earth. Among the most interesting findings, says Nemani, was that the Amazon had experienced a large increase in productivity, apparently because of decreased cloud cover and increased sunlight. “Our analysis indicated that growth in the Amazon was light-limited, rather than water-limited,” explains Nemani. Over the long-term, the Amazon had become more productive in response to greater sunlight. Huete and Nemani thought that the same phenomenon could be operating on the seasonal scale. |
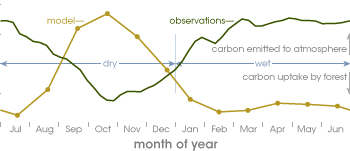
When Saleska and his team first graphed the measurements of carbon dioxide exchange between the forest and the atmosphere at research sites in the Amazon, he thought he had done it backwards. Measurements (green line) were the opposite of predictions from ecosystem models (yellow). Models predicted that the forest would release carbon to the atmosphere (positive exchange) in the dry season (July-December) because water stress would slow growth. Instead, the trees consumed (negative exchange) several hundred kilograms of carbon per hectare per month during the dry season. (Graph by Robert Simmon, adapted from Saleska 2003.) |
