In recent years, satellite sensors have confirmed many of the trends observed by ground-based sensors. “The real beauty of using satellites is that we can apply the same technique to the entire globe in a consistent way,” noted Nicholas Krotkov, a researcher based at NASA Goddard.
In 2011, researchers working with OMI data announced they had detected sharp declines in sulfur dioxide pollution from coal power plants in the eastern United States between 2005-2011. Although the observations only covered a short period, remote sensing scientists considered the work to be a turning point because it marked the first time such fine details about air pollution had been observed from space. The researchers—led by Environment Canada’s Vitali Fioletov, and including Krotkov—had made observations of sulfur dioxide at levels about four times lower than what had been possible before.
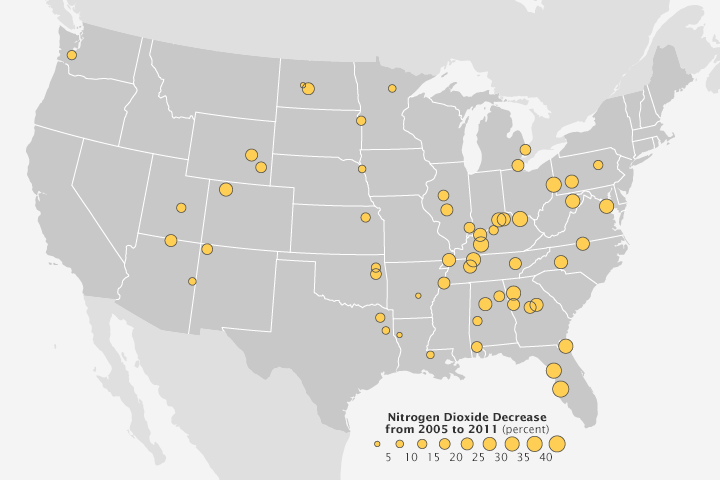
In 2013, another team used OMI data to observe a 30 percent decline in nitrogen dioxide near U.S. power plants between 2005 and 2011. The observation came just as rules went into effect requiring new emission control devices on power plants. “This type of research suggests that satellites might someday play a useful role in tracking the effectiveness of efforts to reduce pollution at individual facilities,” said Duncan.
But improving air quality in one part of the world does not necessarily mean improvement everywhere. While ground-based measurements and satellites suggest falling levels of pollution in North America and Europe, rising levels in Asia have kept the global total about the same.
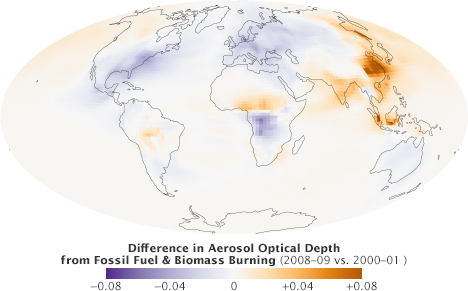
This map shows the difference in aerosol optical depth from fossil fuel and biomass burning between 2008–09 and 2000–01, as analyzed by the GOCART computer model. In general, particles released into the atmosphere by human activity decreased in the U.S. and Europe, and increased in China and India. (NASA map by Robert Simmon, using data from Chin et al. 2014.)
An analysis of satellite measurements of nitrogen dioxide levels over large cities between 1996 and 2011 is representative. Conducted by researchers from the University of Bremen, the study showed that most of the developed world—including Western Europe, the United States, Japan, and Australia—saw nitrogen dioxide levels fall as much as six percent per year. Nitrogen dioxide increased around large cities in China, India, and the Middle East, with Beijing, New Delhi, and Tehran seeing increases of 7 to 8 percent per year.
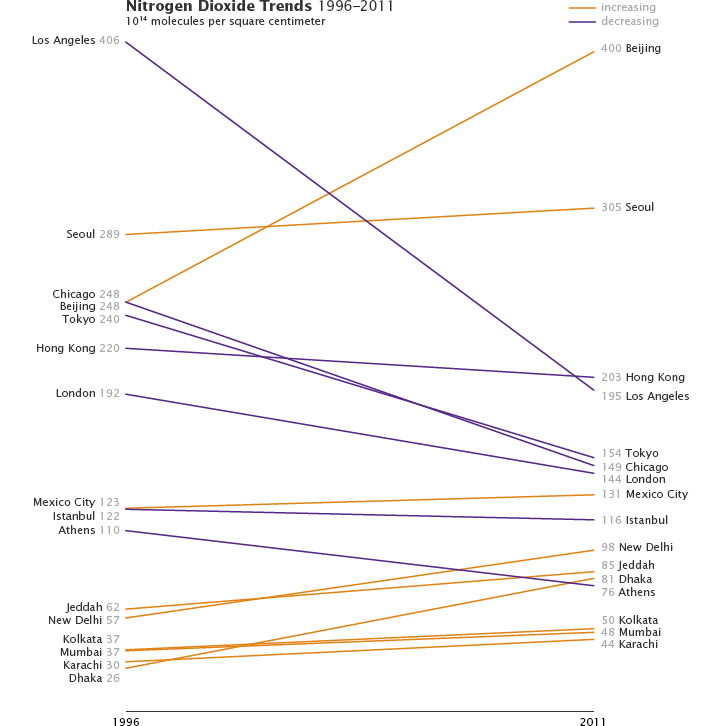
Nitrogen dioxide pollution increased strongly over cities in China, the Middle East, and India from 1996 to 2011. Western Europe, the United States, and Japan showed decreasing amounts over the same period. Monthly data shows these changes in more detail. [Graph by Robert Simmon, data provided by A. Hilboll/University of Bremen (Hilboll et al., 2013)]
Satellites that measure the distribution of aerosols have observed a similar trend. Measurements of aerosols collected by Sea-viewing Wide Field-of-view Sensor (SeaWiFS) between 1997 and 2010 showed significant increases in fine particles over India and China and decreases over North America and Europe.
In 2013, OMI helped illustrate the extent of the problem in India. Scientists using the Aura satellite observed a 63 percent increase in pollution near power plants between 2005 and 2012. However, official Indian government estimates of pollution—based on ground data collected mainly in urban areas—showed sulfur dioxide levels declining. “This implies that the air quality monitoring network needs to be optimized to reflect the true sulfur dioxide situation in India,” noted Zifeng Lu, an atmospheric scientist at Argonne National Laboratory, and his coauthors.
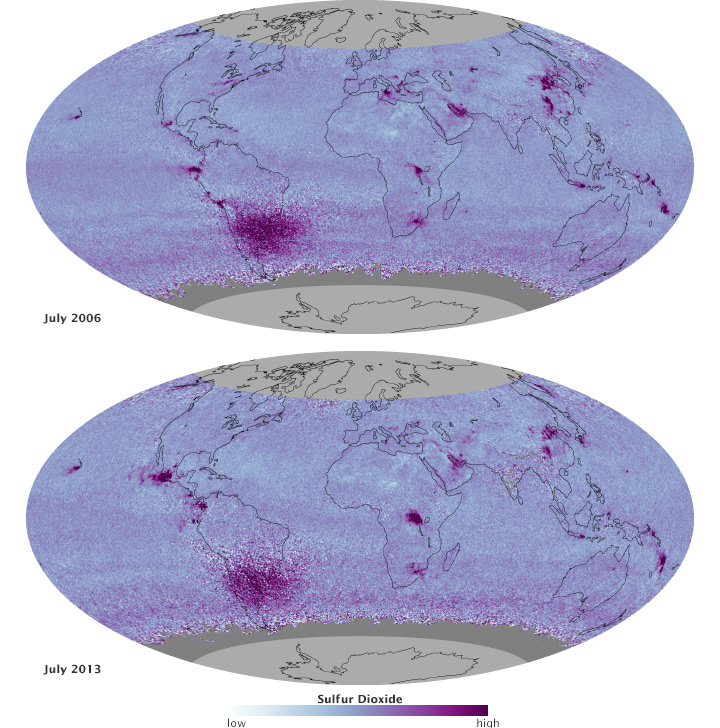
Most of the recent news out of Asia has been negative, but satellites have seen a few hopeful signs as well. After watching sulfur dioxide levels rise between 2000 and 2005, the MODIS sensors on the Terra and Aqua satellites observed a two to seven percent decrease in fine aerosols off the coast of China each year between 2005 and 2010. The authors attribute the changes to the installation of flue-gas desulfurization devices (FGDs) that reduce emissions. Only 13 percent of Chinese power plants had FGDS in 2005 but more than 70 percent had them in 2010. Likewise, an analysis of carbon monoxide data from the Measurements of Pollution in the Troposphere (MOPITT) and other sensors found a decreasing trend of about 1 percent per year in eastern China between 2000 and 2011—likely due to stricter vehicle emission standards and the phasing out of residential coal stoves.
In 2008, satellites even offered a remarkable view of how quickly the air could clear over Beijing. Due to restrictions on automobile and industrial emissions in preparation for the 2008 Olympics, levels of nitrogen dioxide over Beijing temporarily decreased by 43 percent, according to observations made by OMI.
